{"id":"1e623d43-a00b-4644-a989-3c1a53ea486f","entityType":"agent","slug":"clawhub-hith3sh-datadog-monitoring","name":"Datadog","canonicalUrl":"https://www.xpersona.co/agent/clawhub-hith3sh-datadog-monitoring","canonicalPath":"/agent/clawhub-hith3sh-datadog-monitoring","generatedAt":"2026-10-10T07:04:41.776Z","source":"CLAWHUB","claimStatus":"UNCLAIMED","verificationTier":"NONE","summary":{"evidence":{"source":"editorial-content","verified":true,"confidence":"high","updatedAt":"2026-10-09T11:56:34.198Z","emptyReason":null},"description":"Inspect Datadog monitors, metrics, logs, incidents, dashboards, and observability data - powered by ClawLink. Skill: Datadog Owner: hith3sh Summary: Inspect Datadog monitors, metrics, logs, incidents, dashboards, and observability data - powered by ClawLink. Tags: clawlink:0.1.0, integration:0.1.0, latest:1.0.6 Version history: v1.0.6 | 2026-06-09T07:06:00.637Z | user Add UTM attribution tags (utm_source=clawhub) to ClawLink branding links so visits from this skill page are tracked as a distinct traffic source. v1.0.5 | 2026","descriptionLabel":"Technical summary","evidenceSummary":"Capability contract not published. No trust telemetry is available yet. 2.7K downloads reported by the source. Last updated 10/9/2026.","installCommand":"clawhub skill install s173vws87a7ss71xf9rq53k5gd8568kv:datadog-monitoring","sourceUrl":"https://clawhub.ai/hith3sh/datadog-monitoring","homepage":"https://clawhub.ai/hith3sh/skills/datadog-monitoring","primaryLinks":[{"label":"View on ClawHub","url":"https://clawhub.ai/hith3sh/datadog-monitoring","kind":"source"},{"label":"Homepage","url":"https://clawhub.ai/hith3sh/skills/datadog-monitoring","kind":"homepage"}],"safetyScore":84,"overallRank":62,"popularityScore":69,"trustScore":null,"claimedByName":null,"isOwner":false,"seoDescription":"Inspect Datadog monitors, metrics, logs, incidents, dashboards, and observability data - powered by ClawLink. Skill: Datadog Owner: hith3sh Summary: Inspect Dat"},"coverage":{"evidence":{"source":"public-profile","verified":false,"confidence":"medium","updatedAt":"2026-10-09T11:56:34.198Z","emptyReason":null},"protocols":[{"protocol":"OPENCLEW","label":"OpenClaw","status":"self-declared","notes":"Declared in the public agent profile."}],"capabilities":[],"verifiedCount":0,"selfDeclaredCount":1,"capabilityMatrix":{"rows":[{"key":"OPENCLEW","type":"protocol","support":"unknown","confidenceSource":"profile","notes":"Listed on profile"}],"flattenedTokens":"protocol:OPENCLEW|unknown|profile"}},"adoption":{"evidence":{"source":"CLAWHUB","verified":false,"confidence":"medium","updatedAt":"2026-10-09T11:56:34.198Z","emptyReason":null},"stars":null,"forks":null,"downloads":2723,"packageName":null,"latestVersion":"1.0.6","tractionLabel":"2.7K downloads"},"release":{"evidence":{"source":"CLAWHUB","verified":false,"confidence":"medium","updatedAt":"2026-10-09T11:56:34.198Z","emptyReason":null},"lastUpdatedAt":"2026-10-09T11:56:34.198Z","lastCrawledAt":"2026-10-09T11:56:34.198Z","lastIndexedAt":null,"nextCrawlAt":"2026-10-10T11:56:34.198Z","lastVerifiedAt":null,"highlights":[{"version":"1.0.6","createdAt":"2026-06-09T07:06:00.637Z","changelog":"Add UTM attribution tags (utm_source=clawhub) to ClawLink branding links so visits from this skill page are tracked as a distinct traffic source.","fileCount":3,"zipByteSize":5204},{"version":"1.0.5","createdAt":"2026-06-09T06:08:37.859Z","changelog":"- Updated SKILL.md to refresh documentation and branding (including updated Datadog logo URL). - Removed the redundant skill-card.md file.","fileCount":3,"zipByteSize":5179},{"version":"1.0.4","createdAt":"2026-06-09T04:45:27.521Z","changelog":"- Removed the \"skill-card.md\" file from the repository. - No feature, interface, or functionality changes in this release. - Documentation in \"SKILL.md\" remains unchanged.","fileCount":3,"zipByteSize":5036},{"version":"1.0.2","createdAt":"2026-06-08T16:45:37.632Z","changelog":"- No changes detected; this version is functionally identical to the previous release. - Documentation, features, and supported operations remain unchanged.","fileCount":3,"zipByteSize":5136},{"version":"1.0.1","createdAt":"2026-06-08T16:27:19.075Z","changelog":"- Added Datadog logo to documentation for improved visual identification. - Removed obsolete skill-card.md file. - Minor documentation cleanup in SKILL.md for clarity and consistency. - No functional or tool changes.","fileCount":3,"zipByteSize":5019},{"version":"0.1.2","createdAt":"2026-06-07T14:05:40.825Z","changelog":"Add/fix Setup in 3 Steps GIF table so connection GIFs render correctly.","fileCount":3,"zipByteSize":5050},{"version":"0.1.1","createdAt":"2026-06-07T13:28:02.857Z","changelog":"Full rewrite to new standard: added tool reference tables, 3-step GIF table, architecture diagram, code examples, error handling, and troubleshooting.","fileCount":3,"zipByteSize":4845},{"version":"0.1.0","createdAt":"2026-05-16T15:34:23.148Z","changelog":"Initial ClawLink integration skill.","fileCount":3,"zipByteSize":3486}]},"execution":{"evidence":{"source":"CLAWHUB","verified":false,"confidence":"low","updatedAt":null,"emptyReason":"No published capability contract is available yet."},"installCommand":"clawhub skill install s173vws87a7ss71xf9rq53k5gd8568kv:datadog-monitoring","setupComplexity":"low","setupSteps":["Setup complexity is classified as HIGH. You must provision dedicated cloud infrastructure or an isolated VM. Do not run this directly on your local workstation.","Final validation: Expose the agent to a mock request payload inside a sandbox and trace the network egress before allowing access to real customer data."],"contract":{"contractStatus":"missing","authModes":[],"requires":[],"forbidden":[],"supportsMcp":false,"supportsA2a":false,"supportsStreaming":false,"inputSchemaRef":null,"outputSchemaRef":null,"dataRegion":null,"contractUpdatedAt":null,"sourceUpdatedAt":null,"freshnessSeconds":null},"invocationGuide":{"preferredApi":{"snapshotUrl":"https://www.xpersona.co/api/v1/agents/clawhub-hith3sh-datadog-monitoring/snapshot","contractUrl":"https://www.xpersona.co/api/v1/agents/clawhub-hith3sh-datadog-monitoring/contract","trustUrl":"https://www.xpersona.co/api/v1/agents/clawhub-hith3sh-datadog-monitoring/trust"},"curlExamples":["curl -s \"https://www.xpersona.co/api/v1/agents/clawhub-hith3sh-datadog-monitoring/snapshot\"","curl -s \"https://www.xpersona.co/api/v1/agents/clawhub-hith3sh-datadog-monitoring/contract\"","curl -s \"https://www.xpersona.co/api/v1/agents/clawhub-hith3sh-datadog-monitoring/trust\""],"jsonRequestTemplate":{"query":"summarize this repo","constraints":{"maxLatencyMs":2000,"protocolPreference":["OPENCLEW"]}},"jsonResponseTemplate":{"ok":true,"result":{"summary":"...","confidence":0.9},"meta":{"source":"CLAWHUB","generatedAt":"2026-10-10T07:04:41.774Z"}},"retryPolicy":{"maxAttempts":3,"backoffMs":[500,1500,3500],"retryableConditions":["HTTP_429","HTTP_503","NETWORK_TIMEOUT"]}},"endpoints":{"dossierUrl":"https://www.xpersona.co/api/v1/agents/clawhub-hith3sh-datadog-monitoring/dossier","snapshotUrl":"https://www.xpersona.co/api/v1/agents/clawhub-hith3sh-datadog-monitoring/snapshot","contractUrl":"https://www.xpersona.co/api/v1/agents/clawhub-hith3sh-datadog-monitoring/contract","trustUrl":"https://www.xpersona.co/api/v1/agents/clawhub-hith3sh-datadog-monitoring/trust"}},"reliability":{"evidence":{"source":"runtime-metrics","verified":false,"confidence":"low","updatedAt":null,"emptyReason":"No trust, reliability, or runtime telemetry is available."},"trust":{"status":"unavailable","handshakeStatus":"UNKNOWN","verificationFreshnessHours":null,"reputationScore":null,"p95LatencyMs":null,"successRate30d":null,"fallbackRate":null,"attempts30d":null,"trustUpdatedAt":null,"trustConfidence":"unknown","sourceUpdatedAt":null,"freshnessSeconds":null},"decisionGuardrails":{"doNotUseIf":["Contract metadata is missing or unavailable for deterministic execution."],"safeUseWhen":[],"riskFlags":["missing_or_unavailable_contract","trust_data_unavailable","schema_references_missing"],"operationalConfidence":"low"},"executionMetrics":{"observedLatencyMsP50":null,"observedLatencyMsP95":null,"estimatedCostUsd":null,"uptime30d":null,"rateLimitRpm":null,"rateLimitBurst":null,"lastVerifiedAt":null,"verificationSource":null},"runtimeMetrics":{"successRate":null,"avgLatencyMs":null,"avgCostUsd":null,"hallucinationRate":null,"retryRate":null,"disputeRate":null,"p50Latency":null,"p95Latency":null,"lastUpdated":null}},"benchmarks":{"evidence":{"source":"no-benchmark-data","verified":false,"confidence":"low","updatedAt":null,"emptyReason":"No benchmark suites or observed failure patterns are available."},"suites":[],"failurePatterns":[]},"artifacts":{"evidence":{"source":"CLAWHUB","verified":false,"confidence":"high","updatedAt":"2026-10-09T11:56:34.198Z","emptyReason":null},"readme":"Skill: Datadog\n\nOwner: hith3sh\n\nSummary: Inspect Datadog monitors, metrics, logs, incidents, dashboards, and observability data - powered by ClawLink.\n\nTags: clawlink:0.1.0, integration:0.1.0, latest:1.0.6\n\nVersion history:\n\nv1.0.6 | 2026-06-09T07:06:00.637Z | user\n\nAdd UTM attribution tags (utm_source=clawhub) to ClawLink branding links so visits from this skill page are tracked as a distinct traffic source.\n\nv1.0.5 | 2026-06-09T06:08:37.859Z | auto\n\n- Updated SKILL.md to refresh documentation and branding (including updated Datadog logo URL).\n- Removed the redundant skill-card.md file.\n\nv1.0.4 | 2026-06-09T04:45:27.521Z | auto\n\n- Removed the \"skill-card.md\" file from the repository.\n- No feature, interface, or functionality changes in this release.\n- Documentation in \"SKILL.md\" remains unchanged.\n\nv1.0.2 | 2026-06-08T16:45:37.632Z | auto\n\n- No changes detected; this version is functionally identical to the previous release.\n- Documentation, features, and supported operations remain unchanged.\n\nv1.0.1 | 2026-06-08T16:27:19.075Z | auto\n\n- Added Datadog logo to documentation for improved visual identification.\n- Removed obsolete skill-card.md file.\n- Minor documentation cleanup in SKILL.md for clarity and consistency.\n- No functional or tool changes.\n\nv0.1.2 | 2026-06-07T14:05:40.825Z | user\n\nAdd/fix Setup in 3 Steps GIF table so connection GIFs render correctly.\n\nv0.1.1 | 2026-06-07T13:28:02.857Z | user\n\nFull rewrite to new standard: added tool reference tables, 3-step GIF table, architecture diagram, code examples, error handling, and troubleshooting.\n\nv0.1.0 | 2026-05-16T15:34:23.148Z | user\n\nInitial ClawLink integration skill.\n\nArchive index:\n\nArchive v1.0.6: 3 files, 5204 bytes\n\nFiles: skill-card.md (2446b), SKILL.md (11324b), _meta.json (137b)\n\nFile v1.0.6:SKILL.md\n\n---\nname: datadog-monitoring\ndescription: Inspect Datadog monitors, metrics, logs, incidents, dashboards, and observability data - powered by ClawLink.\n---\n\n# Datadog\n\n\n\nWork with Datadog from chat - inspect monitors, metrics, logs, incidents, dashboards, and observability data.\n\nPowered by [ClawLink](https://claw-link.dev/?utm_source=clawhub&utm_medium=referral&utm_content=datadog-monitoring), an integration hub for OpenClaw that handles hosted connection flows and credentials so you don't need to configure Datadog API access yourself.\n\n### Setup in 3 Steps\n\n| Step 1: Install | Step 2: Pair Account | Step 3: Connect Datadog |\n|:---:|:---:|:---:|\n| 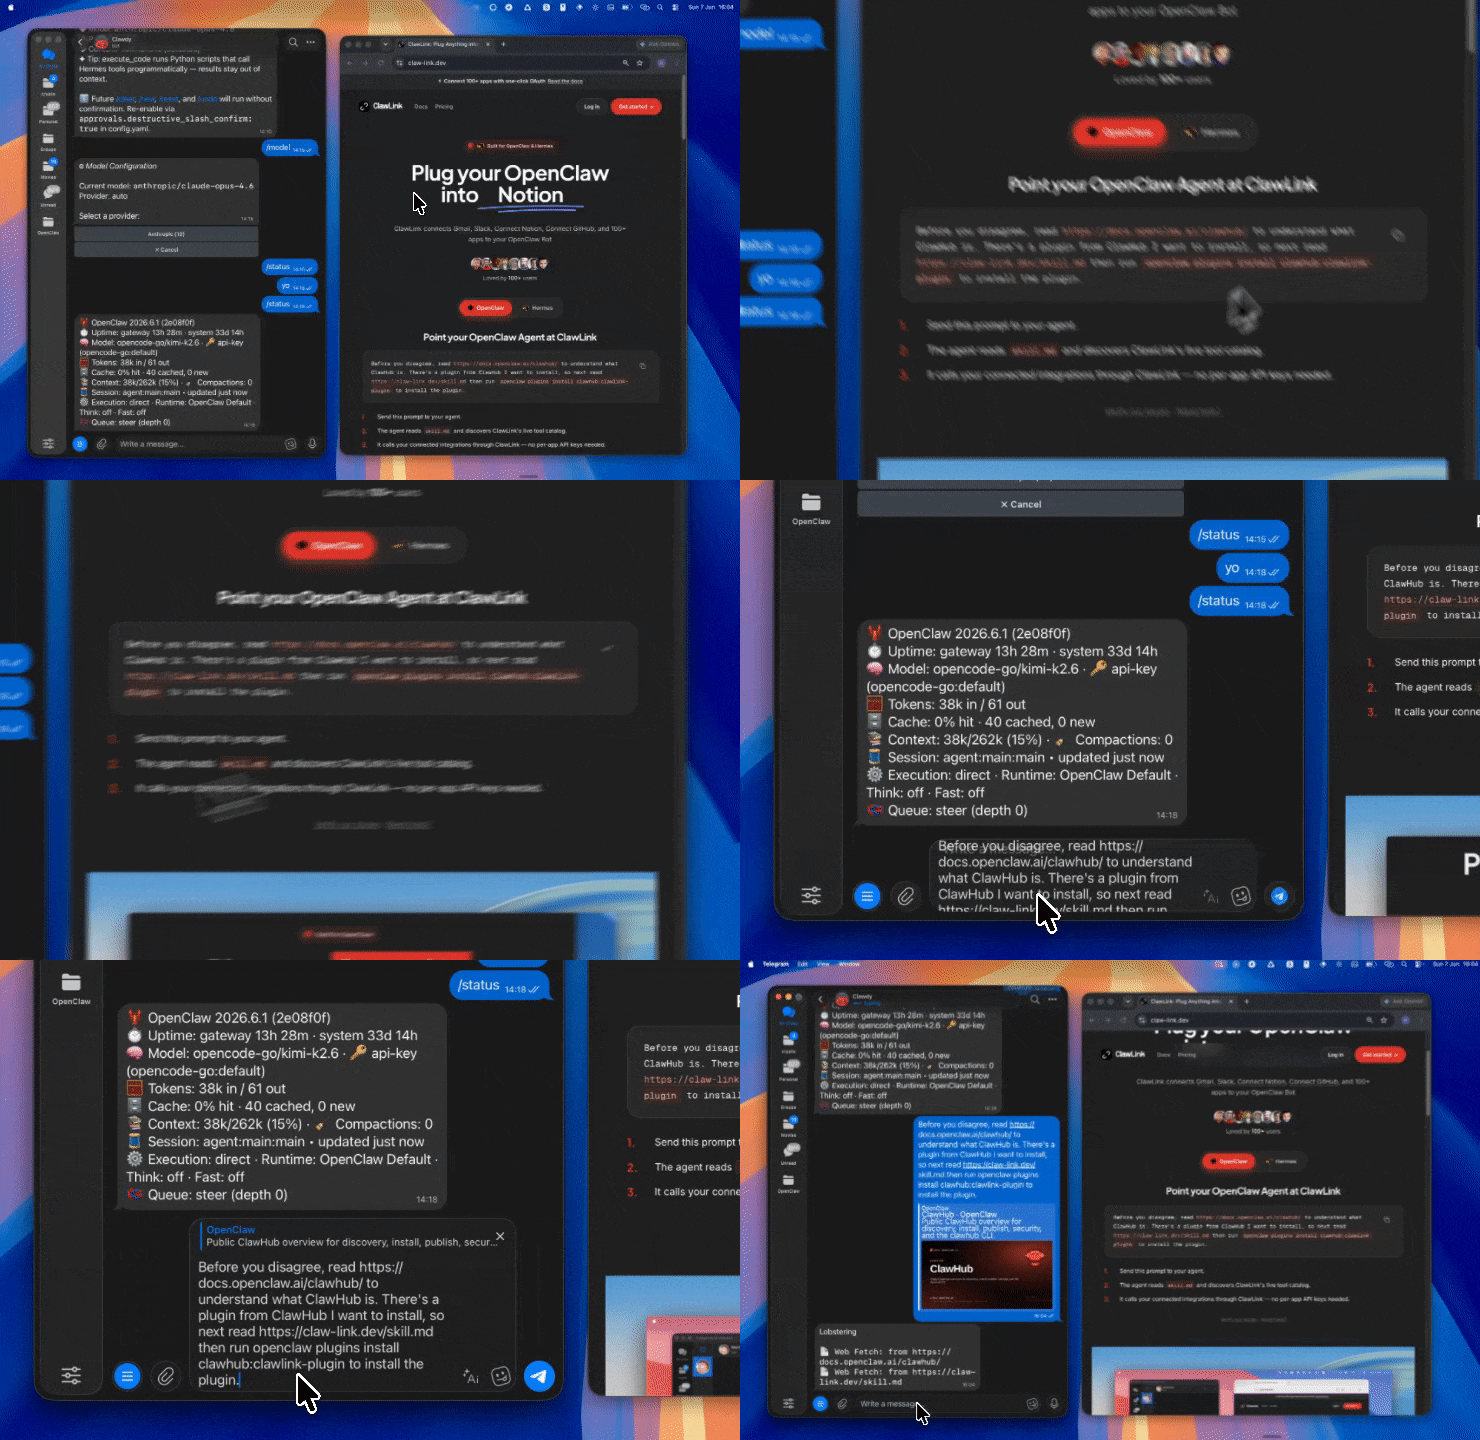 | 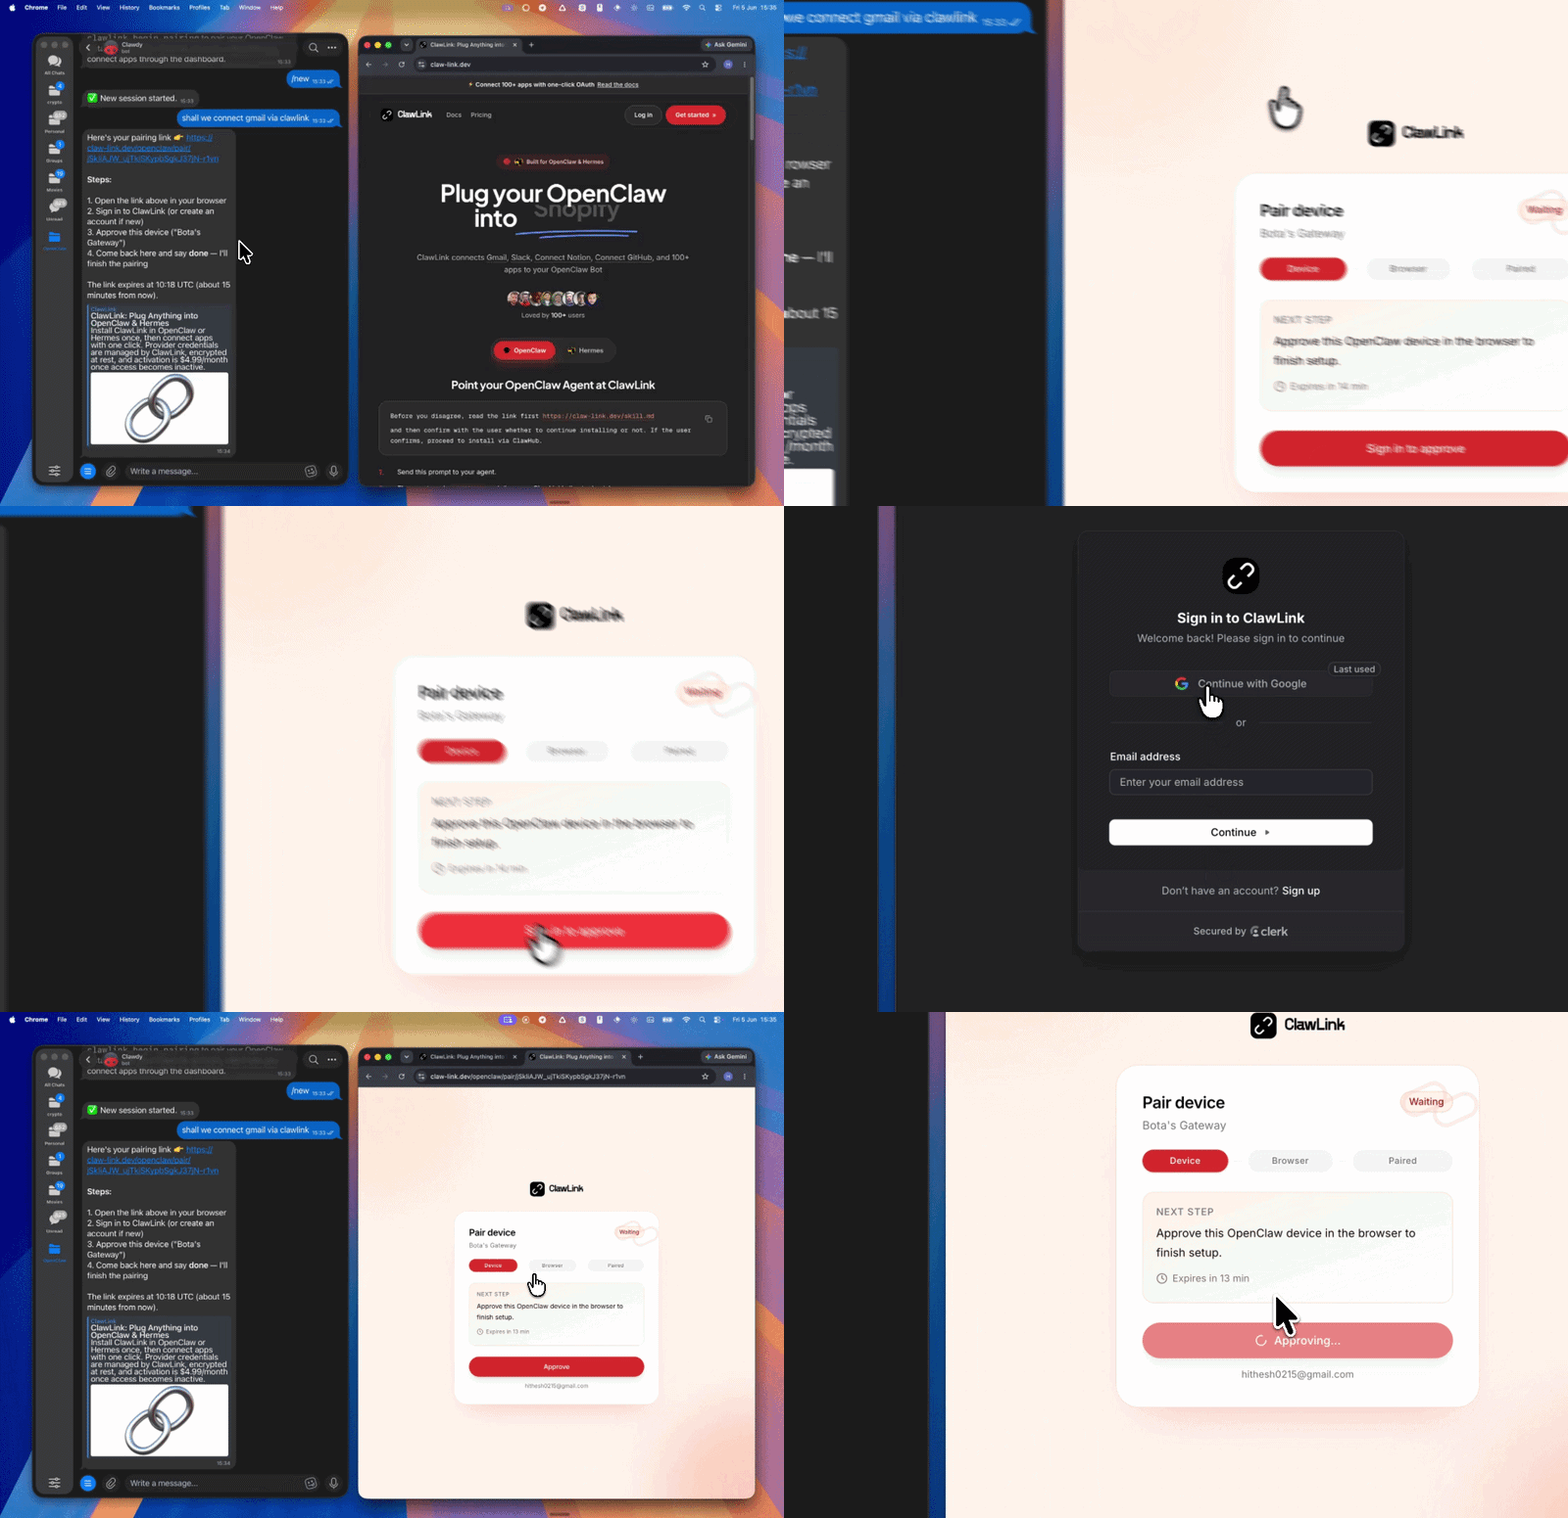 | *App-specific connection GIF coming soon* |\n| Run the install command in OpenClaw | Sign in and approve the device | Open the dashboard and connect Datadog |\n\n## Connection flow\n\n```\nUser → ClawLink OAuth → Datadog account\n ↓\n OpenClaw tools\n (via ClawLink)\n```\n\n**Step 1** — Install the ClawLink plugin:\n```\nopenclaw plugins install clawhub:clawlink-plugin\n```\nStart a fresh chat after installing.\n\n**Step 2** — Pair ClawLink:\n1. Call `clawlink_begin_pairing`\n2. Open the returned URL in your browser\n3. Sign in to ClawLink and approve the device\n\n**Step 3** — Connect Datadog:\nOpen [claw-link.dev/dashboard?add=datadog](https://claw-link.dev/dashboard?add=datadog), complete the OAuth flow, then confirm.\n\n*App-specific connection GIF coming soon*\n\n**Step 4** — Verify and discover:\n```javascript\n// 1. Verify Datadog is connected\nclawlink_list_integrations()\n\n// 2. List available tools\nclawlink_list_tools({ integration: \"datadog\" })\n\n// 3. Search tools if needed\nclawlink_search_tools({ query: \"monitor\", integration: \"datadog\" })\n```\n\n## Architecture\n\n```\n┌─────────────────────────────────────────────────────────┐\n│ OpenClaw (you) │\n├─────────────────────────────────────────────────────────┤\n│ ClawLink Plugin → clawlink_* tools │\n├─────────────────────────────────────────────────────────┤\n│ ClawLink Cloud │\n│ (credentials, connection state, routing) │\n├─────────────────────────────────────────────────────────┤\n│ Datadog API (user's account) │\n└─────────────────────────────────────────────────────────┘\n```\n\n## Tool reference\n\n### Read operations\n\n| Tool | Description | Risk |\n|------|-------------|------|\n| `datadog_get_dashboard` | Get detailed dashboard info including widgets, layout, template variables | safe |\n| `datadog_get_monitor` | Get monitor details, current state, configuration, active downtimes | safe |\n| `datadog_get_service_dependencies` | Get APM service dependency graph (upstream/downstream services) | safe |\n| `datadog_get_synthetics_locations` | List all available public/private synthetic test locations | safe |\n| `datadog_get_tags` | Get all tags associated with a specific host | safe |\n| `datadog_get_usage_summary` | Get usage summary (API calls, hosts, containers, billing metrics) | safe |\n| `datadog_list_all_tags` | List all tags in use across the organization | safe |\n| `datadog_list_api_keys` | List all API keys (names, owners, last-used timestamps) | safe |\n| `datadog_list_apm_services` | List APM services for application performance monitoring | safe |\n| `datadog_list_aws_integration` | List configured AWS account integrations | safe |\n| `datadog_list_dashboards` | List all dashboards with basic info | safe |\n| `datadog_list_events` | List events within a time range (deployments, outages, changes) | safe |\n| `datadog_list_hosts` | List all hosts with metrics, tags, and status | safe |\n| `datadog_list_incidents` | List incidents with timeline and impact tracking | safe |\n| `datadog_list_log_indexes` | List all log indexes (use before searching logs) | safe |\n| `datadog_list_metrics` | Discover active metric names since a given timestamp | safe |\n| `datadog_list_monitors` | Get all monitor details with filtering by group, name, tags | safe |\n| `datadog_list_roles` | List organization roles and their permissions | safe |\n| `datadog_list_service_checks` | List service check statuses for infrastructure components | safe |\n| `datadog_list_sl_os` | List Service Level Objectives and reliability targets | safe |\n| `datadog_list_synthetics` | List synthetic API tests from multiple global locations | safe |\n| `datadog_list_users` | List team members, their roles, and access levels | safe |\n| `datadog_list_webhooks` | List configured webhook integrations | safe |\n| `datadog_query_metrics` | Query time series metric data for custom dashboards/reports | safe |\n| `datadog_search_logs` | Search logs with advanced filtering (time in ms, no sort param) | safe |\n| `datadog_search_spans_analytics` | Analyze span data with aggregations (error rates, latency patterns) | safe |\n| `datadog_search_traces` | Search distributed traces across services | safe |\n\n### Write operations\n\n| Tool | Description | Risk |\n|------|-------------|------|\n| `datadog_create_dashboard` | Create a customizable monitoring dashboard | confirm |\n| `datadog_create_downtime` | Suppress alerts during maintenance windows | confirm |\n| `datadog_create_event` | Track deployments, outages, configuration changes | confirm |\n| `datadog_create_monitor` | Create a monitor with alerting thresholds and notifications | confirm |\n| `datadog_create_slo` | Create a Service Level Objective for reliability tracking | confirm |\n| `datadog_create_synthetic_api_test` | Create a synthetic API test from multiple global locations | confirm |\n| `datadog_create_webhook` | Register a webhook endpoint for monitor notifications | confirm |\n| `datadog_delete_dashboard` | Permanently remove a dashboard | high_impact |\n| `datadog_delete_monitor` | Permanently delete a monitor | high_impact |\n| `datadog_mute_monitor` | Temporarily silence alerts (maintenance windows) | confirm |\n| `datadog_submit_metrics` | Submit custom metrics and business KPIs | confirm |\n| `datadog_unmute_monitor` | Re-enable alerts from a previously muted monitor | confirm |\n| `datadog_update_dashboard` | Update dashboard configuration, widgets, or layout | confirm |\n| `datadog_update_host_tags` | Replace all tags on a specific host | confirm |\n| `datadog_update_monitor` | Update monitor thresholds or notification settings | confirm |\n\n## Code examples\n\n### Example 1: List all monitors and find critical ones\n\n```javascript\n// Get all monitors\nconst monitors = await clawlink_call_tool({\n tool: \"clawlink_list_tools\",\n parameters: { integration: \"datadog\" }\n});\n\n// Then get details for a specific monitor\nconst monitor = await clawlink_call_tool({\n tool: \"datadog_get_monitor\",\n parameters: { monitor_id: \"123456\" }\n});\n\n// Or list all monitors with details\nconst allMonitors = await clawlink_call_tool({\n tool: \"datadog_list_monitors\",\n parameters: {}\n});\n```\n\n### Example 2: Query metrics and search logs\n\n```javascript\n// List available metrics first\nconst metrics = await clawlink_call_tool({\n tool: \"datadog_list_metrics\",\n parameters: { from: 1704067200 }\n});\n\n// Query specific metrics\nconst timeseries = await clawlink_call_tool({\n tool: \"datadog_query_metrics\",\n parameters: {\n query: \"system.cpu.user{*}\",\n from: 1704067200,\n to: 1704153600\n }\n});\n\n// Search logs for errors\nconst errors = await clawlink_call_tool({\n tool: \"datadog_search_logs\",\n parameters: {\n query: \"status:error\",\n from: 1704067200000,\n to: 1704153600000\n }\n});\n```\n\n### Example 3: Create and manage monitors\n\n```javascript\n// Create a monitor\nconst newMonitor = await clawlink_call_tool({\n tool: \"datadog_create_monitor\",\n parameters: {\n name: \"High CPU Alert\",\n type: \"metric alert\",\n query: \"avg(last_5m):system.cpu.user{*} > 90\",\n message: \"CPU usage is above 90%\"\n }\n});\n\n// Mute a monitor during maintenance\nawait clawlink_call_tool({\n tool: \"datadog_mute_monitor\",\n parameters: {\n monitor_id: \"123456\",\n scope: \"env:production\"\n }\n});\n```\n\n### Example 4: Investigate an incident\n\n```javascript\n// List recent incidents\nconst incidents = await clawlink_call_tool({\n tool: \"datadog_list_incidents\",\n parameters: {}\n});\n\n// Get service dependencies for the affected service\nconst deps = await clawlink_call_tool({\n tool: \"datadog_get_service_dependencies\",\n parameters: { service_name: \"payment-service\" }\n});\n\n// Search traces for errors\nconst traces = await clawlink_call_tool({\n tool: \"datadog_search_traces\",\n parameters: { service: \"payment-service\", status: \"error\" }\n});\n```\n\n## Error handling\n\n| Error pattern | Likely cause | Resolution |\n|---------------|--------------|------------|\n| `Monitor not found` | Wrong monitor ID | Call `datadog_list_monitors` to get correct ID |\n| `Permission denied` | Missing Datadog scopes | User may need to reconnect Datadog with full permissions |\n| `Too many results` | Large time range | Narrow the time range or add filters to reduce result size |\n| `Sort parameter not supported` | Using `sort` in log search | Remove `sort` param — Datadog Logs API does not support it |\n| `Invalid type for aggregate_request` | Span analytics schema violation | Use `datadog_search_traces` instead for basic trace search |\n\n## Security & Permissions\n\n- ClawLink stores only the OAuth token, never the raw API key\n- Device credentials are stored locally in OpenClaw plugin config\n- `datadog_list_api_keys` returns metadata only (no secret key values)\n- Datadog OAuth scopes are determined by ClawLink's registered app — user may need to reconnect if scopes change\n\n## Troubleshooting\n\n**Tools not showing up after install:**\n- Start a fresh OpenClaw chat to reload the plugin catalog\n- Call `clawlink_list_integrations` to confirm ClawLink is paired\n\n**\"Integration not connected\" error:**\n- Direct user to [claw-link.dev/dashboard?add=datadog](https://claw-link.dev/dashboard?add=datadog)\n- Confirm they complete the OAuth flow and approve the connection\n\n**Empty results from `datadog_list_events`:**\n- Events are often sparse — start with a broad time range and minimal filters\n- Combining multiple filters (tags + sources + priority) with narrow ranges may return empty results\n\n---\n\nPowered by [ClawLink](https://claw-link.dev/?utm_source=clawhub&utm_medium=referral&utm_content=datadog-monitoring) — your OpenClaw integration hub for Datadog.\n\nFile v1.0.6:_meta.json\n\n{\n \"ownerId\": \"kn713pxvayh8fjhb503zjb8yxh815j54\",\n \"slug\": \"datadog-monitoring\",\n \"version\": \"1.0.6\",\n \"publishedAt\": 1780988760637\n}\n\nFile v1.0.6:skill-card.md\n\n## Description:\n\nInspect Datadog monitors, metrics, logs, incidents, dashboards, and observability data - powered by ClawLink.\n\nThis skill is ready for commercial/non-commercial use.\n\n## Publisher:\n\n[hith3sh](https://clawhub.ai/user/hith3sh)\n\n### License/Terms of Use:\n\nMIT-0\n\n## Use Case:\n\nDevelopers and operations engineers use this skill to inspect and manage Datadog observability data from chat, including monitors, metrics, logs, incidents, dashboards, traces, and service dependencies.\n\n### Deployment Geography for Use:\n\nGlobal\n\n## Known Risks and Mitigations:\n\nRisk: The skill asks users to install an external ClawLink plugin and authorize Datadog access that may include sensitive reads and write operations.\n\nMitigation: Review the ClawLink plugin and requested Datadog OAuth scopes before installation; prefer a dedicated least-privilege Datadog account and avoid broad reconnects unless write operations are required.\n\nRisk: Datadog logs, traces, users, roles, API-key metadata, webhooks, incidents, monitors, and host data can contain confidential operational information.\n\nMitigation: Treat retrieved observability data as confidential and limit access to users and workspaces approved for that Datadog organization.\n\nRisk: Write tools can create, update, mute, unmute, or delete Datadog resources, including monitors and dashboards.\n\nMitigation: Require human confirmation for write and destructive operations, and verify target resource identifiers before execution.\n\n## Reference(s):\n\n- [ClawHub Datadog Skill Page](https://clawhub.ai/hith3sh/skills/datadog-monitoring)\n- [ClawLink](https://claw-link.dev/?utm_source=clawhub&utm_medium=referral&utm_content=datadog-monitoring)\n- [ClawLink Datadog Connection Dashboard](https://claw-link.dev/dashboard?add=datadog)\n\n## Skill Output:\n\n**Output Type(s):** [text, markdown, shell commands, configuration, guidance]\n\n**Output Format:** [Markdown with inline shell commands and tool-call examples]\n\n**Output Parameters:** [1D]\n\n**Other Properties Related to Output:** [May route requests through ClawLink tools connected to the user's Datadog account]\n\n## Skill Version(s):\n\n1.0.6 (source: server release metadata)\n\n## Ethical Considerations:\n\nUsers should evaluate whether this skill is appropriate for their environment, review any generated or modified files before relying on them, and apply their organization's safety, security, and compliance requirements before deployment.\n\nArchive v1.0.5: 3 files, 5179 bytes\n\nFiles: skill-card.md (2455b), SKILL.md (11182b), _meta.json (137b)\n\nFile v1.0.5:SKILL.md\n\n---\nname: datadog-monitoring\ndescription: Inspect Datadog monitors, metrics, logs, incidents, dashboards, and observability data - powered by ClawLink.\n---\n\n# Datadog\n\n\n\nWork with Datadog from chat - inspect monitors, metrics, logs, incidents, dashboards, and observability data.\n\nPowered by [ClawLink](https://claw-link.dev), an integration hub for OpenClaw that handles hosted connection flows and credentials so you don't need to configure Datadog API access yourself.\n\n### Setup in 3 Steps\n\n| Step 1: Install | Step 2: Pair Account | Step 3: Connect Datadog |\n|:---:|:---:|:---:|\n|  |  | *App-specific connection GIF coming soon* |\n| Run the install command in OpenClaw | Sign in and approve the device | Open the dashboard and connect Datadog |\n\n## Connection flow\n\n```\nUser → ClawLink OAuth → Datadog account\n ↓\n OpenClaw tools\n (via ClawLink)\n```\n\n**Step 1** — Install the ClawLink plugin:\n```\nopenclaw plugins install clawhub:clawlink-plugin\n```\nStart a fresh chat after installing.\n\n**Step 2** — Pair ClawLink:\n1. Call `clawlink_begin_pairing`\n2. Open the returned URL in your browser\n3. Sign in to ClawLink and approve the device\n\n**Step 3** — Connect Datadog:\nOpen [claw-link.dev/dashboard?add=datadog](https://claw-link.dev/dashboard?add=datadog), complete the OAuth flow, then confirm.\n\n*App-specific connection GIF coming soon*\n\n**Step 4** — Verify and discover:\n```javascript\n// 1. Verify Datadog is connected\nclawlink_list_integrations()\n\n// 2. List available tools\nclawlink_list_tools({ integration: \"datadog\" })\n\n// 3. Search tools if needed\nclawlink_search_tools({ query: \"monitor\", integration: \"datadog\" })\n```\n\n## Architecture\n\n```\n┌─────────────────────────────────────────────────────────┐\n│ OpenClaw (you) │\n├─────────────────────────────────────────────────────────┤\n│ ClawLink Plugin → clawlink_* tools │\n├─────────────────────────────────────────────────────────┤\n│ ClawLink Cloud │\n│ (credentials, connection state, routing) │\n├─────────────────────────────────────────────────────────┤\n│ Datadog API (user's account) │\n└─────────────────────────────────────────────────────────┘\n```\n\n## Tool reference\n\n### Read operations\n\n| Tool | Description | Risk |\n|------|-------------|------|\n| `datadog_get_dashboard` | Get detailed dashboard info including widgets, layout, template variables | safe |\n| `datadog_get_monitor` | Get monitor details, current state, configuration, active downtimes | safe |\n| `datadog_get_service_dependencies` | Get APM service dependency graph (upstream/downstream services) | safe |\n| `datadog_get_synthetics_locations` | List all available public/private synthetic test locations | safe |\n| `datadog_get_tags` | Get all tags associated with a specific host | safe |\n| `datadog_get_usage_summary` | Get usage summary (API calls, hosts, containers, billing metrics) | safe |\n| `datadog_list_all_tags` | List all tags in use across the organization | safe |\n| `datadog_list_api_keys` | List all API keys (names, owners, last-used timestamps) | safe |\n| `datadog_list_apm_services` | List APM services for application performance monitoring | safe |\n| `datadog_list_aws_integration` | List configured AWS account integrations | safe |\n| `datadog_list_dashboards` | List all dashboards with basic info | safe |\n| `datadog_list_events` | List events within a time range (deployments, outages, changes) | safe |\n| `datadog_list_hosts` | List all hosts with metrics, tags, and status | safe |\n| `datadog_list_incidents` | List incidents with timeline and impact tracking | safe |\n| `datadog_list_log_indexes` | List all log indexes (use before searching logs) | safe |\n| `datadog_list_metrics` | Discover active metric names since a given timestamp | safe |\n| `datadog_list_monitors` | Get all monitor details with filtering by group, name, tags | safe |\n| `datadog_list_roles` | List organization roles and their permissions | safe |\n| `datadog_list_service_checks` | List service check statuses for infrastructure components | safe |\n| `datadog_list_sl_os` | List Service Level Objectives and reliability targets | safe |\n| `datadog_list_synthetics` | List synthetic API tests from multiple global locations | safe |\n| `datadog_list_users` | List team members, their roles, and access levels | safe |\n| `datadog_list_webhooks` | List configured webhook integrations | safe |\n| `datadog_query_metrics` | Query time series metric data for custom dashboards/reports | safe |\n| `datadog_search_logs` | Search logs with advanced filtering (time in ms, no sort param) | safe |\n| `datadog_search_spans_analytics` | Analyze span data with aggregations (error rates, latency patterns) | safe |\n| `datadog_search_traces` | Search distributed traces across services | safe |\n\n### Write operations\n\n| Tool | Description | Risk |\n|------|-------------|------|\n| `datadog_create_dashboard` | Create a customizable monitoring dashboard | confirm |\n| `datadog_create_downtime` | Suppress alerts during maintenance windows | confirm |\n| `datadog_create_event` | Track deployments, outages, configuration changes | confirm |\n| `datadog_create_monitor` | Create a monitor with alerting thresholds and notifications | confirm |\n| `datadog_create_slo` | Create a Service Level Objective for reliability tracking | confirm |\n| `datadog_create_synthetic_api_test` | Create a synthetic API test from multiple global locations | confirm |\n| `datadog_create_webhook` | Register a webhook endpoint for monitor notifications | confirm |\n| `datadog_delete_dashboard` | Permanently remove a dashboard | high_impact |\n| `datadog_delete_monitor` | Permanently delete a monitor | high_impact |\n| `datadog_mute_monitor` | Temporarily silence alerts (maintenance windows) | confirm |\n| `datadog_submit_metrics` | Submit custom metrics and business KPIs | confirm |\n| `datadog_unmute_monitor` | Re-enable alerts from a previously muted monitor | confirm |\n| `datadog_update_dashboard` | Update dashboard configuration, widgets, or layout | confirm |\n| `datadog_update_host_tags` | Replace all tags on a specific host | confirm |\n| `datadog_update_monitor` | Update monitor thresholds or notification settings | confirm |\n\n## Code examples\n\n### Example 1: List all monitors and find critical ones\n\n```javascript\n// Get all monitors\nconst monitors = await clawlink_call_tool({\n tool: \"clawlink_list_tools\",\n parameters: { integration: \"datadog\" }\n});\n\n// Then get details for a specific monitor\nconst monitor = await clawlink_call_tool({\n tool: \"datadog_get_monitor\",\n parameters: { monitor_id: \"123456\" }\n});\n\n// Or list all monitors with details\nconst allMonitors = await clawlink_call_tool({\n tool: \"datadog_list_monitors\",\n parameters: {}\n});\n```\n\n### Example 2: Query metrics and search logs\n\n```javascript\n// List available metrics first\nconst metrics = await clawlink_call_tool({\n tool: \"datadog_list_metrics\",\n parameters: { from: 1704067200 }\n});\n\n// Query specific metrics\nconst timeseries = await clawlink_call_tool({\n tool: \"datadog_query_metrics\",\n parameters: {\n query: \"system.cpu.user{*}\",\n from: 1704067200,\n to: 1704153600\n }\n});\n\n// Search logs for errors\nconst errors = await clawlink_call_tool({\n tool: \"datadog_search_logs\",\n parameters: {\n query: \"status:error\",\n from: 1704067200000,\n to: 1704153600000\n }\n});\n```\n\n### Example 3: Create and manage monitors\n\n```javascript\n// Create a monitor\nconst newMonitor = await clawlink_call_tool({\n tool: \"datadog_create_monitor\",\n parameters: {\n name: \"High CPU Alert\",\n type: \"metric alert\",\n query: \"avg(last_5m):system.cpu.user{*} > 90\",\n message: \"CPU usage is above 90%\"\n }\n});\n\n// Mute a monitor during maintenance\nawait clawlink_call_tool({\n tool: \"datadog_mute_monitor\",\n parameters: {\n monitor_id: \"123456\",\n scope: \"env:production\"\n }\n});\n```\n\n### Example 4: Investigate an incident\n\n```javascript\n// List recent incidents\nconst incidents = await clawlink_call_tool({\n tool: \"datadog_list_incidents\",\n parameters: {}\n});\n\n// Get service dependencies for the affected service\nconst deps = await clawlink_call_tool({\n tool: \"datadog_get_service_dependencies\",\n parameters: { service_name: \"payment-service\" }\n});\n\n// Search traces for errors\nconst traces = await clawlink_call_tool({\n tool: \"datadog_search_traces\",\n parameters: { service: \"payment-service\", status: \"error\" }\n});\n```\n\n## Error handling\n\n| Error pattern | Likely cause | Resolution |\n|---------------|--------------|------------|\n| `Monitor not found` | Wrong monitor ID | Call `datadog_list_monitors` to get correct ID |\n| `Permission denied` | Missing Datadog scopes | User may need to reconnect Datadog with full permissions |\n| `Too many results` | Large time range | Narrow the time range or add filters to reduce result size |\n| `Sort parameter not supported` | Using `sort` in log search | Remove `sort` param — Datadog Logs API does not support it |\n| `Invalid type for aggregate_request` | Span analytics schema violation | Use `datadog_search_traces` instead for basic trace search |\n\n## Security & Permissions\n\n- ClawLink stores only the OAuth token, never the raw API key\n- Device credentials are stored locally in OpenClaw plugin config\n- `datadog_list_api_keys` returns metadata only (no secret key values)\n- Datadog OAuth scopes are determined by ClawLink's registered app — user may need to reconnect if scopes change\n\n## Troubleshooting\n\n**Tools not showing up after install:**\n- Start a fresh OpenClaw chat to reload the plugin catalog\n- Call `clawlink_list_integrations` to confirm ClawLink is paired\n\n**\"Integration not connected\" error:**\n- Direct user to [claw-link.dev/dashboard?add=datadog](https://claw-link.dev/dashboard?add=datadog)\n- Confirm they complete the OAuth flow and approve the connection\n\n**Empty results from `datadog_list_events`:**\n- Events are often sparse — start with a broad time range and minimal filters\n- Combining multiple filters (tags + sources + priority) with narrow ranges may return empty results\n\n---\n\nPowered by [ClawLink](https://claw-link.dev) — your OpenClaw integration hub for Datadog.\n\nFile v1.0.5:_meta.json\n\n{\n \"ownerId\": \"kn713pxvayh8fjhb503zjb8yxh815j54\",\n \"slug\": \"datadog-monitoring\",\n \"version\": \"1.0.5\",\n \"publishedAt\": 1780985317859\n}\n\nFile v1.0.5:skill-card.md\n\n## Description:
\nInspect Datadog monitors, metrics, logs, incidents, dashboards, and observability data - powered by ClawLink.
\n\nThis skill is ready for commercial/non-commercial use.
\n\n## Publisher:
\n[hith3sh](https://clawhub.ai/user/hith3sh)
\n\n### License/Terms of Use:
\nMIT-0
\n\n\n## Use Case:
\nDevelopers and operations teams use this skill to inspect and manage Datadog observability resources from chat through ClawLink. It supports monitor, metric, log, incident, dashboard, SLO, synthetic test, trace, and service investigation workflows.
\n\n### Deployment Geography for Use:
\nGlobal
\n\n## Known Risks and Mitigations:
\nRisk: The skill can use ClawLink and Datadog permissions to create, update, mute, and delete monitoring resources.
\nMitigation: Grant only the Datadog scopes needed for the intended workflow and review proposed write actions before execution.
\nRisk: Users expecting read-only inspection may overlook that monitor and dashboard deletion tools are available.
\nMitigation: Avoid delete and update tools unless the action is explicitly intended, and restrict scopes or access policies for read-only usage.
\nRisk: The skill requires OAuth or sensitive credentials through ClawLink to access Datadog account data.
\nMitigation: Use approved accounts, complete OAuth only through the documented ClawLink flow, and rotate or revoke access when no longer needed.
\n\n\n## Reference(s):
\n- [ClawHub Datadog skill page](https://clawhub.ai/hith3sh/datadog-monitoring)
\n- [ClawLink](https://claw-link.dev)
\n- [ClawLink Datadog connection dashboard](https://claw-link.dev/dashboard?add=datadog)
\n\n\n## Skill Output:
\n**Output Type(s):** [text, markdown, code, shell commands, configuration, guidance]
\n**Output Format:** [Markdown with inline shell and JavaScript examples]
\n**Output Parameters:** [1D]
\n**Other Properties Related to Output:** [May invoke ClawLink-hosted Datadog API tools that return observability data or mutate monitoring resources when the user authorizes those actions.]
\n\n## Skill Version(s):
\n1.0.5 (source: server release evidence)
\n\n## Ethical Considerations:
\nUsers should evaluate whether this skill is appropriate for their environment, review any generated or modified files before relying on them, and apply their organization's safety, security, and compliance requirements before deployment.
\n\nArchive v1.0.4: 3 files, 5036 bytes\n\nFiles: skill-card.md (2174b), SKILL.md (11178b), _meta.json (137b)\n\nFile v1.0.4:SKILL.md\n\n---\nname: datadog-monitoring\ndescription: Inspect Datadog monitors, metrics, logs, incidents, dashboards, and observability data - powered by ClawLink.\n---\n\n# Datadog\n\n\n\nWork with Datadog from chat - inspect monitors, metrics, logs, incidents, dashboards, and observability data.\n\nPowered by [ClawLink](https://claw-link.dev), an integration hub for OpenClaw that handles hosted connection flows and credentials so you don't need to configure Datadog API access yourself.\n\n### Setup in 3 Steps\n\n| Step 1: Install | Step 2: Pair Account | Step 3: Connect Datadog |\n|:---:|:---:|:---:|\n|  |  | *App-specific connection GIF coming soon* |\n| Run the install command in OpenClaw | Sign in and approve the device | Open the dashboard and connect Datadog |\n\n## Connection flow\n\n```\nUser → ClawLink OAuth → Datadog account\n ↓\n OpenClaw tools\n (via ClawLink)\n```\n\n**Step 1** — Install the ClawLink plugin:\n```\nopenclaw plugins install clawhub:clawlink-plugin\n```\nStart a fresh chat after installing.\n\n**Step 2** — Pair ClawLink:\n1. Call `clawlink_begin_pairing`\n2. Open the returned URL in your browser\n3. Sign in to ClawLink and approve the device\n\n**Step 3** — Connect Datadog:\nOpen [claw-link.dev/dashboard?add=datadog](https://claw-link.dev/dashboard?add=datadog), complete the OAuth flow, then confirm.\n\n*App-specific connection GIF coming soon*\n\n**Step 4** — Verify and discover:\n```javascript\n// 1. Verify Datadog is connected\nclawlink_list_integrations()\n\n// 2. List available tools\nclawlink_list_tools({ integration: \"datadog\" })\n\n// 3. Search tools if needed\nclawlink_search_tools({ query: \"monitor\", integration: \"datadog\" })\n```\n\n## Architecture\n\n```\n┌─────────────────────────────────────────────────────────┐\n│ OpenClaw (you) │\n├─────────────────────────────────────────────────────────┤\n│ ClawLink Plugin → clawlink_* tools │\n├─────────────────────────────────────────────────────────┤\n│ ClawLink Cloud │\n│ (credentials, connection state, routing) │\n├─────────────────────────────────────────────────────────┤\n│ Datadog API (user's account) │\n└─────────────────────────────────────────────────────────┘\n```\n\n## Tool reference\n\n### Read operations\n\n| Tool | Description | Risk |\n|------|-------------|------|\n| `datadog_get_dashboard` | Get detailed dashboard info including widgets, layout, template variables | safe |\n| `datadog_get_monitor` | Get monitor details, current state, configuration, active downtimes | safe |\n| `datadog_get_service_dependencies` | Get APM service dependency graph (upstream/downstream services) | safe |\n| `datadog_get_synthetics_locations` | List all available public/private synthetic test locations | safe |\n| `datadog_get_tags` | Get all tags associated with a specific host | safe |\n| `datadog_get_usage_summary` | Get usage summary (API calls, hosts, containers, billing metrics) | safe |\n| `datadog_list_all_tags` | List all tags in use across the organization | safe |\n| `datadog_list_api_keys` | List all API keys (names, owners, last-used timestamps) | safe |\n| `datadog_list_apm_services` | List APM services for application performance monitoring | safe |\n| `datadog_list_aws_integration` | List configured AWS account integrations | safe |\n| `datadog_list_dashboards` | List all dashboards with basic info | safe |\n| `datadog_list_events` | List events within a time range (deployments, outages, changes) | safe |\n| `datadog_list_hosts` | List all hosts with metrics, tags, and status | safe |\n| `datadog_list_incidents` | List incidents with timeline and impact tracking | safe |\n| `datadog_list_log_indexes` | List all log indexes (use before searching logs) | safe |\n| `datadog_list_metrics` | Discover active metric names since a given timestamp | safe |\n| `datadog_list_monitors` | Get all monitor details with filtering by group, name, tags | safe |\n| `datadog_list_roles` | List organization roles and their permissions | safe |\n| `datadog_list_service_checks` | List service check statuses for infrastructure components | safe |\n| `datadog_list_sl_os` | List Service Level Objectives and reliability targets | safe |\n| `datadog_list_synthetics` | List synthetic API tests from multiple global locations | safe |\n| `datadog_list_users` | List team members, their roles, and access levels | safe |\n| `datadog_list_webhooks` | List configured webhook integrations | safe |\n| `datadog_query_metrics` | Query time series metric data for custom dashboards/reports | safe |\n| `datadog_search_logs` | Search logs with advanced filtering (time in ms, no sort param) | safe |\n| `datadog_search_spans_analytics` | Analyze span data with aggregations (error rates, latency patterns) | safe |\n| `datadog_search_traces` | Search distributed traces across services | safe |\n\n### Write operations\n\n| Tool | Description | Risk |\n|------|-------------|------|\n| `datadog_create_dashboard` | Create a customizable monitoring dashboard | confirm |\n| `datadog_create_downtime` | Suppress alerts during maintenance windows | confirm |\n| `datadog_create_event` | Track deployments, outages, configuration changes | confirm |\n| `datadog_create_monitor` | Create a monitor with alerting thresholds and notifications | confirm |\n| `datadog_create_slo` | Create a Service Level Objective for reliability tracking | confirm |\n| `datadog_create_synthetic_api_test` | Create a synthetic API test from multiple global locations | confirm |\n| `datadog_create_webhook` | Register a webhook endpoint for monitor notifications | confirm |\n| `datadog_delete_dashboard` | Permanently remove a dashboard | high_impact |\n| `datadog_delete_monitor` | Permanently delete a monitor | high_impact |\n| `datadog_mute_monitor` | Temporarily silence alerts (maintenance windows) | confirm |\n| `datadog_submit_metrics` | Submit custom metrics and business KPIs | confirm |\n| `datadog_unmute_monitor` | Re-enable alerts from a previously muted monitor | confirm |\n| `datadog_update_dashboard` | Update dashboard configuration, widgets, or layout | confirm |\n| `datadog_update_host_tags` | Replace all tags on a specific host | confirm |\n| `datadog_update_monitor` | Update monitor thresholds or notification settings | confirm |\n\n## Code examples\n\n### Example 1: List all monitors and find critical ones\n\n```javascript\n// Get all monitors\nconst monitors = await clawlink_call_tool({\n tool: \"clawlink_list_tools\",\n parameters: { integration: \"datadog\" }\n});\n\n// Then get details for a specific monitor\nconst monitor = await clawlink_call_tool({\n tool: \"datadog_get_monitor\",\n parameters: { monitor_id: \"123456\" }\n});\n\n// Or list all monitors with details\nconst allMonitors = await clawlink_call_tool({\n tool: \"datadog_list_monitors\",\n parameters: {}\n});\n```\n\n### Example 2: Query metrics and search logs\n\n```javascript\n// List available metrics first\nconst metrics = await clawlink_call_tool({\n tool: \"datadog_list_metrics\",\n parameters: { from: 1704067200 }\n});\n\n// Query specific metrics\nconst timeseries = await clawlink_call_tool({\n tool: \"datadog_query_metrics\",\n parameters: {\n query: \"system.cpu.user{*}\",\n from: 1704067200,\n to: 1704153600\n }\n});\n\n// Search logs for errors\nconst errors = await clawlink_call_tool({\n tool: \"datadog_search_logs\",\n parameters: {\n query: \"status:error\",\n from: 1704067200000,\n to: 1704153600000\n }\n});\n```\n\n### Example 3: Create and manage monitors\n\n```javascript\n// Create a monitor\nconst newMonitor = await clawlink_call_tool({\n tool: \"datadog_create_monitor\",\n parameters: {\n name: \"High CPU Alert\",\n type: \"metric alert\",\n query: \"avg(last_5m):system.cpu.user{*} > 90\",\n message: \"CPU usage is above 90%\"\n }\n});\n\n// Mute a monitor during maintenance\nawait clawlink_call_tool({\n tool: \"datadog_mute_monitor\",\n parameters: {\n monitor_id: \"123456\",\n scope: \"env:production\"\n }\n});\n```\n\n### Example 4: Investigate an incident\n\n```javascript\n// List recent incidents\nconst incidents = await clawlink_call_tool({\n tool: \"datadog_list_incidents\",\n parameters: {}\n});\n\n// Get service dependencies for the affected service\nconst deps = await clawlink_call_tool({\n tool: \"datadog_get_service_dependencies\",\n parameters: { service_name: \"payment-service\" }\n});\n\n// Search traces for errors\nconst traces = await clawlink_call_tool({\n tool: \"datadog_search_traces\",\n parameters: { service: \"payment-service\", status: \"error\" }\n});\n```\n\n## Error handling\n\n| Error pattern | Likely cause | Resolution |\n|---------------|--------------|------------|\n| `Monitor not found` | Wrong monitor ID | Call `datadog_list_monitors` to get correct ID |\n| `Permission denied` | Missing Datadog scopes | User may need to reconnect Datadog with full permissions |\n| `Too many results` | Large time range | Narrow the time range or add filters to reduce result size |\n| `Sort parameter not supported` | Using `sort` in log search | Remove `sort` param — Datadog Logs API does not support it |\n| `Invalid type for aggregate_request` | Span analytics schema violation | Use `datadog_search_traces` instead for basic trace search |\n\n## Security & Permissions\n\n- ClawLink stores only the OAuth token, never the raw API key\n- Device credentials are stored locally in OpenClaw plugin config\n- `datadog_list_api_keys` returns metadata only (no secret key values)\n- Datadog OAuth scopes are determined by ClawLink's registered app — user may need to reconnect if scopes change\n\n## Troubleshooting\n\n**Tools not showing up after install:**\n- Start a fresh OpenClaw chat to reload the plugin catalog\n- Call `clawlink_list_integrations` to confirm ClawLink is paired\n\n**\"Integration not connected\" error:**\n- Direct user to [claw-link.dev/dashboard?add=datadog](https://claw-link.dev/dashboard?add=datadog)\n- Confirm they complete the OAuth flow and approve the connection\n\n**Empty results from `datadog_list_events`:**\n- Events are often sparse — start with a broad time range and minimal filters\n- Combining multiple filters (tags + sources + priority) with narrow ranges may return empty results\n\n---\n\nPowered by [ClawLink](https://claw-link.dev) — your OpenClaw integration hub for Datadog.\n\nFile v1.0.4:_meta.json\n\n{\n \"ownerId\": \"kn713pxvayh8fjhb503zjb8yxh815j54\",\n \"slug\": \"datadog-monitoring\",\n \"version\": \"1.0.4\",\n \"publishedAt\": 1780980327521\n}\n\nFile v1.0.4:skill-card.md\n\n## Description:
\nInspect Datadog monitors, metrics, logs, incidents, dashboards, and observability data - powered by ClawLink.
\n\nThis skill is ready for commercial/non-commercial use.
\n\n## Publisher:
\n[hith3sh](https://clawhub.ai/user/hith3sh)
\n\n### License/Terms of Use:
\nMIT-0
\n\n\n## Use Case:
\nDevelopers and operations teams use this skill to inspect Datadog observability data, investigate incidents, query metrics and logs, and manage dashboards, monitors, SLOs, synthetics, and related resources through ClawLink.
\n\n### Deployment Geography for Use:
\nGlobal
\n\n## Known Risks and Mitigations:
\nRisk: Datadog access can expose sensitive operational data, including services, users, roles, hosts, tags, logs, traces, incidents, integrations, and API key metadata.
\nMitigation: Use least-privilege Datadog access where possible and review requests before running tools that read sensitive observability data.
\nRisk: Write, mute, update, and delete operations can change monitoring behavior or remove Datadog resources.
\nMitigation: Review intended changes carefully before approving write operations, especially monitor, dashboard, downtime, mute, unmute, update, and delete actions.
\n\n\n## Reference(s):
\n- [ClawHub skill page](https://clawhub.ai/hith3sh/datadog-monitoring)
\n- [ClawLink](https://claw-link.dev)
\n- [ClawLink Datadog connection](https://claw-link.dev/dashboard?add=datadog)
\n\n\n## Skill Output:
\n**Output Type(s):** [guidance, shell commands, code, configuration, API calls]
\n**Output Format:** [Markdown with inline shell commands and JavaScript examples]
\n**Output Parameters:** [1D]
\n**Other Properties Related to Output:** [Includes read and write tool examples for Datadog operations through ClawLink.]
\n\n## Skill Version(s):
\n1.0.4 (source: server release metadata)
\n\n## Ethical Considerations:
\nUsers should evaluate whether this skill is appropriate for their environment, review any generated or modified files before relying on them, and apply their organization's safety, security, and compliance requirements before deployment.
\n\nArchive v1.0.2: 3 files, 5136 bytes\n\nFiles: skill-card.md (2479b), SKILL.md (11178b), _meta.json (137b)\n\nFile v1.0.2:SKILL.md\n\n---\nname: datadog-monitoring\ndescription: Inspect Datadog monitors, metrics, logs, incidents, dashboards, and observability data - powered by ClawLink.\n---\n\n# Datadog\n\n\n\nWork with Datadog from chat - inspect monitors, metrics, logs, incidents, dashboards, and observability data.\n\nPowered by [ClawLink](https://claw-link.dev), an integration hub for OpenClaw that handles hosted connection flows and credentials so you don't need to configure Datadog API access yourself.\n\n### Setup in 3 Steps\n\n| Step 1: Install | Step 2: Pair Account | Step 3: Connect Datadog |\n|:---:|:---:|:---:|\n|  |  | *App-specific connection GIF coming soon* |\n| Run the install command in OpenClaw | Sign in and approve the device | Open the dashboard and connect Datadog |\n\n## Connection flow\n\n```\nUser → ClawLink OAuth → Datadog account\n ↓\n OpenClaw tools\n (via ClawLink)\n```\n\n**Step 1** — Install the ClawLink plugin:\n```\nopenclaw plugins install clawhub:clawlink-plugin\n```\nStart a fresh chat after installing.\n\n**Step 2** — Pair ClawLink:\n1. Call `clawlink_begin_pairing`\n2. Open the returned URL in your browser\n3. Sign in to ClawLink and approve the device\n\n**Step 3** — Connect Datadog:\nOpen [claw-link.dev/dashboard?add=datadog](https://claw-link.dev/dashboard?add=datadog), complete the OAuth flow, then confirm.\n\n*App-specific connection GIF coming soon*\n\n**Step 4** — Verify and discover:\n```javascript\n// 1. Verify Datadog is connected\nclawlink_list_integrations()\n\n// 2. List available tools\nclawlink_list_tools({ integration: \"datadog\" })\n\n// 3. Search tools if needed\nclawlink_search_tools({ query: \"monitor\", integration: \"datadog\" })\n```\n\n## Architecture\n\n```\n┌─────────────────────────────────────────────────────────┐\n│ OpenClaw (you) │\n├─────────────────────────────────────────────────────────┤\n│ ClawLink Plugin → clawlink_* tools │\n├─────────────────────────────────────────────────────────┤\n│ ClawLink Cloud │\n│ (credentials, connection state, routing) │\n├─────────────────────────────────────────────────────────┤\n│ Datadog API (user's account) │\n└─────────────────────────────────────────────────────────┘\n```\n\n## Tool reference\n\n### Read operations\n\n| Tool | Description | Risk |\n|------|-------------|------|\n| `datadog_get_dashboard` | Get detailed dashboard info including widgets, layout, template variables | safe |\n| `datadog_get_monitor` | Get monitor details, current state, configuration, active downtimes | safe |\n| `datadog_get_service_dependencies` | Get APM service dependency graph (upstream/downstream services) | safe |\n| `datadog_get_synthetics_locations` | List all available public/private synthetic test locations | safe |\n| `datadog_get_tags` | Get all tags associated with a specific host | safe |\n| `datadog_get_usage_summary` | Get usage summary (API calls, hosts, containers, billing metrics) | safe |\n| `datadog_list_all_tags` | List all tags in use across the organization | safe |\n| `datadog_list_api_keys` | List all API keys (names, owners, last-used timestamps) | safe |\n| `datadog_list_apm_services` | List APM services for application performance monitoring | safe |\n| `datadog_list_aws_integration` | List configured AWS account integrations | safe |\n| `datadog_list_dashboards` | List all dashboards with basic info | safe |\n| `datadog_list_events` | List events within a time range (deployments, outages, changes) | safe |\n| `datadog_list_hosts` | List all hosts with metrics, tags, and status | safe |\n| `datadog_list_incidents` | List incidents with timeline and impact tracking | safe |\n| `datadog_list_log_indexes` | List all log indexes (use before searching logs) | safe |\n| `datadog_list_metrics` | Discover active metric names since a given timestamp | safe |\n| `datadog_list_monitors` | Get all monitor details with filtering by group, name, tags | safe |\n| `datadog_list_roles` | List organization roles and their permissions | safe |\n| `datadog_list_service_checks` | List service check statuses for infrastructure components | safe |\n| `datadog_list_sl_os` | List Service Level Objectives and reliability targets | safe |\n| `datadog_list_synthetics` | List synthetic API tests from multiple global locations | safe |\n| `datadog_list_users` | List team members, their roles, and access levels | safe |\n| `datadog_list_webhooks` | List configured webhook integrations | safe |\n| `datadog_query_metrics` | Query time series metric data for custom dashboards/reports | safe |\n| `datadog_search_logs` | Search logs with advanced filtering (time in ms, no sort param) | safe |\n| `datadog_search_spans_analytics` | Analyze span data with aggregations (error rates, latency patterns) | safe |\n| `datadog_search_traces` | Search distributed traces across services | safe |\n\n### Write operations\n\n| Tool | Description | Risk |\n|------|-------------|------|\n| `datadog_create_dashboard` | Create a customizable monitoring dashboard | confirm |\n| `datadog_create_downtime` | Suppress alerts during maintenance windows | confirm |\n| `datadog_create_event` | Track deployments, outages, configuration changes | confirm |\n| `datadog_create_monitor` | Create a monitor with alerting thresholds and notifications | confirm |\n| `datadog_create_slo` | Create a Service Level Objective for reliability tracking | confirm |\n| `datadog_create_synthetic_api_test` | Create a synthetic API test from multiple global locations | confirm |\n| `datadog_create_webhook` | Register a webhook endpoint for monitor notifications | confirm |\n| `datadog_delete_dashboard` | Permanently remove a dashboard | high_impact |\n| `datadog_delete_monitor` | Permanently delete a monitor | high_impact |\n| `datadog_mute_monitor` | Temporarily silence alerts (maintenance windows) | confirm |\n| `datadog_submit_metrics` | Submit custom metrics and business KPIs | confirm |\n| `datadog_unmute_monitor` | Re-enable alerts from a previously muted monitor | confirm |\n| `datadog_update_dashboard` | Update dashboard configuration, widgets, or layout | confirm |\n| `datadog_update_host_tags` | Replace all tags on a specific host | confirm |\n| `datadog_update_monitor` | Update monitor thresholds or notification settings | confirm |\n\n## Code examples\n\n### Example 1: List all monitors and find critical ones\n\n```javascript\n// Get all monitors\nconst monitors = await clawlink_call_tool({\n tool: \"clawlink_list_tools\",\n parameters: { integration: \"datadog\" }\n});\n\n// Then get details for a specific monitor\nconst monitor = await clawlink_call_tool({\n tool: \"datadog_get_monitor\",\n parameters: { monitor_id: \"123456\" }\n});\n\n// Or list all monitors with details\nconst allMonitors = await clawlink_call_tool({\n tool: \"datadog_list_monitors\",\n parameters: {}\n});\n```\n\n### Example 2: Query metrics and search logs\n\n```javascript\n// List available metrics first\nconst metrics = await clawlink_call_tool({\n tool: \"datadog_list_metrics\",\n parameters: { from: 1704067200 }\n});\n\n// Query specific metrics\nconst timeseries = await clawlink_call_tool({\n tool: \"datadog_query_metrics\",\n parameters: {\n query: \"system.cpu.user{*}\",\n from: 1704067200,\n to: 1704153600\n }\n});\n\n// Search logs for errors\nconst errors = await clawlink_call_tool({\n tool: \"datadog_search_logs\",\n parameters: {\n query: \"status:error\",\n from: 1704067200000,\n to: 1704153600000\n }\n});\n```\n\n### Example 3: Create and manage monitors\n\n```javascript\n// Create a monitor\nconst newMonitor = await clawlink_call_tool({\n tool: \"datadog_create_monitor\",\n parameters: {\n name: \"High CPU Alert\",\n type: \"metric alert\",\n query: \"avg(last_5m):system.cpu.user{*} > 90\",\n message: \"CPU usage is above 90%\"\n }\n});\n\n// Mute a monitor during maintenance\nawait clawlink_call_tool({\n tool: \"datadog_mute_monitor\",\n parameters: {\n monitor_id: \"123456\",\n scope: \"env:production\"\n }\n});\n```\n\n### Example 4: Investigate an incident\n\n```javascript\n// List recent incidents\nconst incidents = await clawlink_call_tool({\n tool: \"datadog_list_incidents\",\n parameters: {}\n});\n\n// Get service dependencies for the affected service\nconst deps = await clawlink_call_tool({\n tool: \"datadog_get_service_dependencies\",\n parameters: { service_name: \"payment-service\" }\n});\n\n// Search traces for errors\nconst traces = await clawlink_call_tool({\n tool: \"datadog_search_traces\",\n parameters: { service: \"payment-service\", status: \"error\" }\n});\n```\n\n## Error handling\n\n| Error pattern | Likely cause | Resolution |\n|---------------|--------------|------------|\n| `Monitor not found` | Wrong monitor ID | Call `datadog_list_monitors` to get correct ID |\n| `Permission denied` | Missing Datadog scopes | User may need to reconnect Datadog with full permissions |\n| `Too many results` | Large time range | Narrow the time range or add filters to reduce result size |\n| `Sort parameter not supported` | Using `sort` in log search | Remove `sort` param — Datadog Logs API does not support it |\n| `Invalid type for aggregate_request` | Span analytics schema violation | Use `datadog_search_traces` instead for basic trace search |\n\n## Security & Permissions\n\n- ClawLink stores only the OAuth token, never the raw API key\n- Device credentials are stored locally in OpenClaw plugin config\n- `datadog_list_api_keys` returns metadata only (no secret key values)\n- Datadog OAuth scopes are determined by ClawLink's registered app — user may need to reconnect if scopes change\n\n## Troubleshooting\n\n**Tools not showing up after install:**\n- Start a fresh OpenClaw chat to reload the plugin catalog\n- Call `clawlink_list_integrations` to confirm ClawLink is paired\n\n**\"Integration not connected\" error:**\n- Direct user to [claw-link.dev/dashboard?add=datadog](https://claw-link.dev/dashboard?add=datadog)\n- Confirm they complete the OAuth flow and approve the connection\n\n**Empty results from `datadog_list_events`:**\n- Events are often sparse — start with a broad time range and minimal filters\n- Combining multiple filters (tags + sources + priority) with narrow ranges may return empty results\n\n---\n\nPowered by [ClawLink](https://claw-link.dev) — your OpenClaw integration hub for Datadog.\n\nFile v1.0.2:_meta.json\n\n{\n \"ownerId\": \"kn713pxvayh8fjhb503zjb8yxh815j54\",\n \"slug\": \"datadog-monitoring\",\n \"version\": \"1.0.2\",\n \"publishedAt\": 1780937137632\n}\n\nFile v1.0.2:skill-card.md\n\n## Description:
\nInspect Datadog monitors, metrics, logs, incidents, dashboards, and observability data - powered by ClawLink.
\n\nThis skill is ready for commercial/non-commercial use.
\n\n## Publisher:
\n[hith3sh](https://clawhub.ai/user/hith3sh)
\n\n### License/Terms of Use:
\nMIT-0
\n\n\n## Use Case:
\nDevelopers and operations teams use this skill to inspect Datadog observability data, discover available Datadog tools, and manage monitors, dashboards, incidents, metrics, logs, traces, webhooks, and related configuration through ClawLink.
\n\n### Deployment Geography for Use:
\nGlobal
\n\n## Known Risks and Mitigations:
\nRisk: The skill requires Datadog OAuth access through ClawLink.
\nMitigation: Install only if you trust ClawLink with Datadog access and confirm the connected Datadog account before use.
\nRisk: Write operations can create, update, mute, or delete Datadog resources, including monitors, dashboards, webhooks, downtimes, metrics, and SLOs.
\nMitigation: Review tool previews and explicitly approve create, update, mute, webhook, metric submission, and delete actions before execution.
\nRisk: Datadog API results may expose sensitive operational metadata such as users, roles, hosts, logs, incidents, traces, monitors, dashboards, and API key metadata.
\nMitigation: Use the skill in trusted workspaces and avoid sharing outputs containing organization-specific observability or access metadata.
\n\n\n## Reference(s):
\n- [ClawHub Datadog skill page](https://clawhub.ai/hith3sh/datadog-monitoring)
\n- [ClawLink](https://claw-link.dev)
\n- [ClawLink Datadog connection dashboard](https://claw-link.dev/dashboard?add=datadog)
\n\n\n## Skill Output:
\n**Output Type(s):** [text, markdown, code, shell commands, configuration, guidance]
\n**Output Format:** [Markdown with inline shell and JavaScript code blocks]
\n**Output Parameters:** [1D]
\n**Other Properties Related to Output:** [May include Datadog tool names, OAuth pairing steps, query examples, operational guidance, and confirmation guidance for write or delete actions.]
\n\n## Skill Version(s):
\n1.0.2 (source: release evidence)
\n\n## Ethical Considerations:
\nUsers should evaluate whether this skill is appropriate for their environment, review any generated or modified files before relying on them, and apply their organization's safety, security, and compliance requirements before deployment.
\n\nArchive v1.0.1: 3 files, 5019 bytes\n\nFiles: skill-card.md (2163b), SKILL.md (11178b), _meta.json (137b)\n\nFile v1.0.1:SKILL.md\n\n---\nname: datadog-monitoring\ndescription: Inspect Datadog monitors, metrics, logs, incidents, dashboards, and observability data - powered by ClawLink.\n---\n\n# Datadog\n\n\n\nWork with Datadog from chat - inspect monitors, metrics, logs, incidents, dashboards, and observability data.\n\nPowered by [ClawLink](https://claw-link.dev), an integration hub for OpenClaw that handles hosted connection flows and credentials so you don't need to configure Datadog API access yourself.\n\n### Setup in 3 Steps\n\n| Step 1: Install | Step 2: Pair Account | Step 3: Connect Datadog |\n|:---:|:---:|:---:|\n|  |  | *App-specific connection GIF coming soon* |\n| Run the install command in OpenClaw | Sign in and approve the device | Open the dashboard and connect Datadog |\n\n## Connection flow\n\n```\nUser → ClawLink OAuth → Datadog account\n ↓\n OpenClaw tools\n (via ClawLink)\n```\n\n**Step 1** — Install the ClawLink plugin:\n```\nopenclaw plugins install clawhub:clawlink-plugin\n```\nStart a fresh chat after installing.\n\n**Step 2** — Pair ClawLink:\n1. Call `clawlink_begin_pairing`\n2. Open the returned URL in your browser\n3. Sign in to ClawLink and approve the device\n\n**Step 3** — Connect Datadog:\nOpen [claw-link.dev/dashboard?add=datadog](https://claw-link.dev/dashboard?add=datadog), complete the OAuth flow, then confirm.\n\n*App-specific connection GIF coming soon*\n\n**Step 4** — Verify and discover:\n```javascript\n// 1. Verify Datadog is connected\nclawlink_list_integrations()\n\n// 2. List available tools\nclawlink_list_tools({ integration: \"datadog\" })\n\n// 3. Search tools if needed\nclawlink_search_tools({ query: \"monitor\", integration: \"datadog\" })\n```\n\n## Architecture\n\n```\n┌─────────────────────────────────────────────────────────┐\n│ OpenClaw (you) │\n├─────────────────────────────────────────────────────────┤\n│ ClawLink Plugin → clawlink_* tools │\n├─────────────────────────────────────────────────────────┤\n│ ClawLink Cloud │\n│ (credentials, connection state, routing) │\n├─────────────────────────────────────────────────────────┤\n│ Datadog API (user's account) │\n└─────────────────────────────────────────────────────────┘\n```\n\n## Tool reference\n\n### Read operations\n\n| Tool | Description | Risk |\n|------|-------------|------|\n| `datadog_get_dashboard` | Get detailed dashboard info including widgets, layout, template variables | safe |\n| `datadog_get_monitor` | Get monitor details, current state, configuration, active downtimes | safe |\n| `datadog_get_service_dependencies` | Get APM service dependency graph (upstream/downstream services) | safe |\n| `datadog_get_synthetics_locations` | List all available public/private synthetic test locations | safe |\n| `datadog_get_tags` | Get all tags associated with a specific host | safe |\n| `datadog_get_usage_summary` | Get usage summary (API calls, hosts, containers, billing metrics) | safe |\n| `datadog_list_all_tags` | List all tags in use across the organization | safe |\n| `datadog_list_api_keys` | List all API keys (names, owners, last-used timestamps) | safe |\n| `datadog_list_apm_services` | List APM services for application performance monitoring | safe |\n| `datadog_list_aws_integration` | List configured AWS account integrations | safe |\n| `datadog_list_dashboards` | List all dashboards with basic info | safe |\n| `datadog_list_events` | List events within a time range (deployments, outages, changes) | safe |\n| `datadog_list_hosts` | List all hosts with metrics, tags, and status | safe |\n| `datadog_list_incidents` | List incidents with timeline and impact tracking | safe |\n| `datadog_list_log_indexes` | List all log indexes (use before searching logs) | safe |\n| `datadog_list_metrics` | Discover active metric names since a given timestamp | safe |\n| `datadog_list_monitors` | Get all monitor details with filtering by group, name, tags | safe |\n| `datadog_list_roles` | List organization roles and their permissions | safe |\n| `datadog_list_service_checks` | List service check statuses for infrastructure components | safe |\n| `datadog_list_sl_os` | List Service Level Objectives and reliability targets | safe |\n| `datadog_list_synthetics` | List synthetic API tests from multiple global locations | safe |\n| `datadog_list_users` | List team members, their roles, and access levels | safe |\n| `datadog_list_webhooks` | List configured webhook integrations | safe |\n| `datadog_query_metrics` | Query time series metric data for custom dashboards/reports | safe |\n| `datadog_search_logs` | Search logs with advanced filtering (time in ms, no sort param) | safe |\n| `datadog_search_spans_analytics` | Analyze span data with aggregations (error rates, latency patterns) | safe |\n| `datadog_search_traces` | Search distributed traces across services | safe |\n\n### Write operations\n\n| Tool | Description | Risk |\n|------|-------------|------|\n| `datadog_create_dashboard` | Create a customizable monitoring dashboard | confirm |\n| `datadog_create_downtime` | Suppress alerts during maintenance windows | confirm |\n| `datadog_create_event` | Track deployments, outages, configuration changes | confirm |\n| `datadog_create_monitor` | Create a monitor with alerting thresholds and notifications | confirm |\n| `datadog_create_slo` | Create a Service Level Objective for reliability tracking | confirm |\n| `datadog_create_synthetic_api_test` | Create a synthetic API test from multiple global locations | confirm |\n| `datadog_create_webhook` | Register a webhook endpoint for monitor notifications | confirm |\n| `datadog_delete_dashboard` | Permanently remove a dashboard | high_impact |\n| `datadog_delete_monitor` | Permanently delete a monitor | high_impact |\n| `datadog_mute_monitor` | Temporarily silence alerts (maintenance windows) | confirm |\n| `datadog_submit_metrics` | Submit custom metrics and business KPIs | confirm |\n| `datadog_unmute_monitor` | Re-enable alerts from a previously muted monitor | confirm |\n| `datadog_update_dashboard` | Update dashboard configuration, widgets, or layout | confirm |\n| `datadog_update_host_tags` | Replace all tags on a specific host | confirm |\n| `datadog_update_monitor` | Update monitor thresholds or notification settings | confirm |\n\n## Code examples\n\n### Example 1: List all monitors and find critical ones\n\n```javascript\n// Get all monitors\nconst monitors = await clawlink_call_tool({\n tool: \"clawlink_list_tools\",\n parameters: { integration: \"datadog\" }\n});\n\n// Then get details for a specific monitor\nconst monitor = await clawlink_call_tool({\n tool: \"datadog_get_monitor\",\n parameters: { monitor_id: \"123456\" }\n});\n\n// Or list all monitors with details\nconst allMonitors = await clawlink_call_tool({\n tool: \"datadog_list_monitors\",\n parameters: {}\n});\n```\n\n### Example 2: Query metrics and search logs\n\n```javascript\n// List available metrics first\nconst metrics = await clawlink_call_tool({\n tool: \"datadog_list_metrics\",\n parameters: { from: 1704067200 }\n});\n\n// Query specific metrics\nconst timeseries = await clawlink_call_tool({\n tool: \"datadog_query_metrics\",\n parameters: {\n query: \"system.cpu.user{*}\",\n from: 1704067200,\n to: 1704153600\n }\n});\n\n// Search logs for errors\nconst errors = await clawlink_call_tool({\n tool: \"datadog_search_logs\",\n parameters: {\n query: \"status:error\",\n from: 1704067200000,\n to: 1704153600000\n }\n});\n```\n\n### Example 3: Create and manage monitors\n\n```javascript\n// Create a monitor\nconst newMonitor = await clawlink_call_tool({\n tool: \"datadog_create_monitor\",\n parameters: {\n name: \"High CPU Alert\",\n type: \"metric alert\",\n query: \"avg(last_5m):system.cpu.user{*} > 90\",\n message: \"CPU usage is above 90%\"\n }\n});\n\n// Mute a monitor during maintenance\nawait clawlink_call_tool({\n tool: \"datadog_mute_monitor\",\n parameters: {\n monitor_id: \"123456\",\n scope: \"env:production\"\n }\n});\n```\n\n### Example 4: Investigate an incident\n\n```javascript\n// List recent incidents\nconst incidents = await clawlink_call_tool({\n tool: \"datadog_list_incidents\",\n parameters: {}\n});\n\n// Get service dependencies for the affected service\nconst deps = await clawlink_call_tool({\n tool: \"datadog_get_service_dependencies\",\n parameters: { service_name: \"payment-service\" }\n});\n\n// Search traces for errors\nconst traces = await clawlink_call_tool({\n tool: \"datadog_search_traces\",\n parameters: { service: \"payment-service\", status: \"error\" }\n});\n```\n\n## Error handling\n\n| Error pattern | Likely cause | Resolution |\n|---------------|--------------|------------|\n| `Monitor not found` | Wrong monitor ID | Call `datadog_list_monitors` to get correct ID |\n| `Permission denied` | Missing Datadog scopes | User may need to reconnect Datadog with full permissions |\n| `Too many results` | Large time range | Narrow the time range or add filters to reduce result size |\n| `Sort parameter not supported` | Using `sort` in log search | Remove `sort` param — Datadog Logs API does not support it |\n| `Invalid type for aggregate_request` | Span analytics schema violation | Use `datadog_search_traces` instead for basic trace search |\n\n## Security & Permissions\n\n- ClawLink stores only the OAuth token, never the raw API key\n- Device credentials are stored locally in OpenClaw plugin config\n- `datadog_list_api_keys` returns metadata only (no secret key values)\n- Datadog OAuth scopes are determined by ClawLink's registered app — user may need to reconnect if scopes change\n\n## Troubleshooting\n\n**Tools not showing up after install:**\n- Start a fresh OpenClaw chat to reload the plugin catalog\n- Call `clawlink_list_integrations` to confirm ClawLink is paired\n\n**\"Integration not connected\" error:**\n- Direct user to [claw-link.dev/dashboard?add=datadog](https://claw-link.dev/dashboard?add=datadog)\n- Confirm they complete the OAuth flow and approve the connection\n\n**Empty results from `datadog_list_events`:**\n- Events are often sparse — start with a broad time range and minimal filters\n- Combining multiple filters (tags + sources + priority) with narrow ranges may return empty results\n\n---\n\nPowered by [ClawLink](https://claw-link.dev) — your OpenClaw integration hub for Datadog.\n\nFile v1.0.1:_meta.json\n\n{\n \"ownerId\": \"kn713pxvayh8fjhb503zjb8yxh815j54\",\n \"slug\": \"datadog-monitoring\",\n \"version\": \"1.0.1\",\n \"publishedAt\": 1780936039075\n}\n\nFile v1.0.1:skill-card.md\n\n## Description:
\nInspect Datadog monitors, metrics, logs, incidents, dashboards, and observability data - powered by ClawLink.
\n\nThis skill is ready for commercial/non-commercial use.
\n\n## Publisher:
\n[hith3sh](https://clawhub.ai/user/hith3sh)
\n\n### License/Terms of Use:
\nMIT-0
\n\n\n## Use Case:
\nDevelopers, operators, and incident responders use this skill to inspect Datadog observability data and manage monitors, dashboards, incidents, logs, traces, SLOs, webhooks, and related account information from an agent conversation.
\n\n### Deployment Geography for Use:
\nGlobal
\n\n## Known Risks and Mitigations:
\nRisk: The skill requires ClawLink access to a user's Datadog account and can read observability and account metadata.
\nMitigation: Install only when this access is acceptable, review Datadog OAuth scopes, and connect the least-privileged account suitable for the task.
\nRisk: The skill exposes operations that can create, update, mute, unmute, submit, or delete Datadog resources.
\nMitigation: Require explicit confirmation before any write, alert-silencing, metric-submission, or delete operation.
\n\n\n## Reference(s):
\n- [ClawHub Datadog Skill Page](https://clawhub.ai/hith3sh/datadog-monitoring)
\n- [ClawLink](https://claw-link.dev)
\n- [ClawLink Datadog Connection](https://claw-link.dev/dashboard?add=datadog)
\n\n\n## Skill Output:
\n**Output Type(s):** [text, markdown, shell commands, configuration, guidance]
\n**Output Format:** [Markdown with inline code blocks and tool-use guidance]
\n**Output Parameters:** [1D]
\n**Other Properties Related to Output:** [May guide Datadog read, create, update, mute, unmute, submit, and delete operations through ClawLink after the user connects a Datadog account.]
\n\n## Skill Version(s):
\n1.0.1 (source: server release evidence)
\n\n## Ethical Considerations:
\nUsers should evaluate whether this skill is appropriate for their environment, review any generated or modified files before relying on them, and apply their organization's safety, security, and compliance requirements before deployment.
\n\nArchive v0.1.2: 3 files, 5050 bytes\n\nFiles: skill-card.md (2295b), SKILL.md (11067b), _meta.json (137b)\n\nFile v0.1.2:SKILL.md\n\n---\nname: datadog-monitoring\ndescription: Inspect Datadog monitors, metrics, logs, incidents, dashboards, and observability data - powered by ClawLink.\n---\n\n# Datadog\n\nWork with Datadog from chat - inspect monitors, metrics, logs, incidents, dashboards, and observability data.\n\nPowered by [ClawLink](https://claw-link.dev), an integration hub for OpenClaw that handles hosted connection flows and credentials so you don't need to configure Datadog API access yourself.\n\n### Setup in 3 Steps\n\n| Step 1: Install | Step 2: Pair Account | Step 3: Connect Datadog |\n|:---:|:---:|:---:|\n|  |  | *App-specific connection GIF coming soon* |\n| Run the install command in OpenClaw | Sign in and approve the device | Open the dashboard and connect Datadog |\n\n## Connection flow\n\n```\nUser → ClawLink OAuth → Datadog account\n ↓\n OpenClaw tools\n (via ClawLink)\n```\n\n**Step 1** — Install the ClawLink plugin:\n```\nopenclaw plugins install clawhub:clawlink-plugin\n```\nStart a fresh chat after installing.\n\n**Step 2** — Pair ClawLink:\n1. Call `clawlink_begin_pairing`\n2. Open the returned URL in your browser\n3. Sign in to ClawLink and approve the device\n\n**Step 3** — Connect Datadog:\nOpen [claw-link.dev/dashboard?add=datadog](https://claw-link.dev/dashboard?add=datadog), complete the OAuth flow, then confirm.\n\n*App-specific connection GIF coming soon*\n\n**Step 4** — Verify and discover:\n```javascript\n// 1. Verify Datadog is connected\nclawlink_list_integrations()\n\n// 2. List available tools\nclawlink_list_tools({ integration: \"datadog\" })\n\n// 3. Search tools if needed\nclawlink_search_tools({ query: \"monitor\", integration: \"datadog\" })\n```\n\n## Architecture\n\n```\n┌─────────────────────────────────────────────────────────┐\n│ OpenClaw (you) │\n├─────────────────────────────────────────────────────────┤\n│ ClawLink Plugin → clawlink_* tools │\n├─────────────────────────────────────────────────────────┤\n│ ClawLink Cloud │\n│ (credentials, connection state, routing) │\n├─────────────────────────────────────────────────────────┤\n│ Datadog API (user's account) │\n└─────────────────────────────────────────────────────────┘\n```\n\n## Tool reference\n\n### Read operations\n\n| Tool | Description | Risk |\n|------|-------------|------|\n| `datadog_get_dashboard` | Get detailed dashboard info including widgets, layout, template variables | safe |\n| `datadog_get_monitor` | Get monitor details, current state, configuration, active downtimes | safe |\n| `datadog_get_service_dependencies` | Get APM service dependency graph (upstream/downstream services) | safe |\n| `datadog_get_synthetics_locations` | List all available public/private synthetic test locations | safe |\n| `datadog_get_tags` | Get all tags associated with a specific host | safe |\n| `datadog_get_usage_summary` | Get usage summary (API calls, hosts, containers, billing metrics) | safe |\n| `datadog_list_all_tags` | List all tags in use across the organization | safe |\n| `datadog_list_api_keys` | List all API keys (names, owners, last-used timestamps) | safe |\n| `datadog_list_apm_services` | List APM services for application performance monitoring | safe |\n| `datadog_list_aws_integration` | List configured AWS account integrations | safe |\n| `datadog_list_dashboards` | List all dashboards with basic info | safe |\n| `datadog_list_events` | List events within a time range (deployments, outages, changes) | safe |\n| `datadog_list_hosts` | List all hosts with metrics, tags, and status | safe |\n| `datadog_list_incidents` | List incidents with timeline and impact tracking | safe |\n| `datadog_list_log_indexes` | List all log indexes (use before searching logs) | safe |\n| `datadog_list_metrics` | Discover active metric names since a given timestamp | safe |\n| `datadog_list_monitors` | Get all monitor details with filtering by group, name, tags | safe |\n| `datadog_list_roles` | List organization roles and their permissions | safe |\n| `datadog_list_service_checks` | List service check statuses for infrastructure components | safe |\n| `datadog_list_sl_os` | List Service Level Objectives and reliability targets | safe |\n| `datadog_list_synthetics` | List synthetic API tests from multiple global locations | safe |\n| `datadog_list_users` | List team members, their roles, and access levels | safe |\n| `datadog_list_webhooks` | List configured webhook integrations | safe |\n| `datadog_query_metrics` | Query time series metric data for custom dashboards/reports | safe |\n| `datadog_search_logs` | Search logs with advanced filtering (time in ms, no sort param) | safe |\n| `datadog_search_spans_analytics` | Analyze span data with aggregations (error rates, latency patterns) | safe |\n| `datadog_search_traces` | Search distributed traces across services | safe |\n\n### Write operations\n\n| Tool | Description | Risk |\n|------|-------------|------|\n| `datadog_create_dashboard` | Create a customizable monitoring dashboard | confirm |\n| `datadog_create_downtime` | Suppress alerts during maintenance windows | confirm |\n| `datadog_create_event` | Track deployments, outages, configuration changes | confirm |\n| `datadog_create_monitor` | Create a monitor with alerting thresholds and notifications | confirm |\n| `datadog_create_slo` | Create a Service Level Objective for reliability tracking | confirm |\n| `datadog_create_synthetic_api_test` | Create a synthetic API test from multiple global locations | confirm |\n| `datadog_create_webhook` | Register a webhook endpoint for monitor notifications | confirm |\n| `datadog_delete_dashboard` | Permanently remove a dashboard | high_impact |\n| `datadog_delete_monitor` | Permanently delete a monitor | high_impact |\n| `datadog_mute_monitor` | Temporarily silence alerts (maintenance windows) | confirm |\n| `datadog_submit_metrics` | Submit custom metrics and business KPIs | confirm |\n| `datadog_unmute_monitor` | Re-enable alerts from a previously muted monitor | confirm |\n| `datadog_update_dashboard` | Update dashboard configuration, widgets, or layout | confirm |\n| `datadog_update_host_tags` | Replace all tags on a specific host | confirm |\n| `datadog_update_monitor` | Update monitor thresholds or notification settings | confirm |\n\n## Code examples\n\n### Example 1: List all monitors and find critical ones\n\n```javascript\n// Get all monitors\nconst monitors = await clawlink_call_tool({\n tool: \"clawlink_list_tools\",\n parameters: { integration: \"datadog\" }\n});\n\n// Then get details for a specific monitor\nconst monitor = await clawlink_call_tool({\n tool: \"datadog_get_monitor\",\n parameters: { monitor_id: \"123456\" }\n});\n\n// Or list all monitors with details\nconst allMonitors = await clawlink_call_tool({\n tool: \"datadog_list_monitors\",\n parameters: {}\n});\n```\n\n### Example 2: Query metrics and search logs\n\n```javascript\n// List available metrics first\nconst metrics = await clawlink_call_tool({\n tool: \"datadog_list_metrics\",\n parameters: { from: 1704067200 }\n});\n\n// Query specific metrics\nconst timeseries = await clawlink_call_tool({\n tool: \"datadog_query_metrics\",\n parameters: {\n query: \"system.cpu.user{*}\",\n from: 1704067200,\n to: 1704153600\n }\n});\n\n// Search logs for errors\nconst errors = await clawlink_call_tool({\n tool: \"datadog_search_logs\",\n parameters: {\n query: \"status:error\",\n from: 1704067200000,\n to: 1704153600000\n }\n});\n```\n\n### Example 3: Create and manage monitors\n\n```javascript\n// Create a monitor\nconst newMonitor = await clawlink_call_tool({\n tool: \"datadog_create_monitor\",\n parameters: {\n name: \"High CPU Alert\",\n type: \"metric alert\",\n query: \"avg(last_5m):system.cpu.user{*} > 90\",\n message: \"CPU usage is above 90%\"\n }\n});\n\n// Mute a monitor during maintenance\nawait clawlink_call_tool({\n tool: \"datadog_mute_monitor\",\n parameters: {\n monitor_id: \"123456\",\n scope: \"env:production\"\n }\n});\n```\n\n### Example 4: Investigate an incident\n\n```javascript\n// List recent incidents\nconst incidents = await clawlink_call_tool({\n tool: \"datadog_list_incidents\",\n parameters: {}\n});\n\n// Get service dependencies for the affected service\nconst deps = await clawlink_call_tool({\n tool: \"datadog_get_service_dependencies\",\n parameters: { service_name: \"payment-service\" }\n});\n\n// Search traces for errors\nconst traces = await clawlink_call_tool({\n tool: \"datadog_search_traces\",\n parameters: { service: \"payment-service\", status: \"error\" }\n});\n```\n\n## Error handling\n\n| Error pattern | Likely cause | Resolution |\n|---------------|--------------|------------|\n| `Monitor not found` | Wrong monitor ID | Call `datadog_list_monitors` to get correct ID |\n| `Permission denied` | Missing Datadog scopes | User may need to reconnect Datadog with full permissions |\n| `Too many results` | Large time range | Narrow the time range or add filters to reduce result size |\n| `Sort parameter not supported` | Using `sort` in log search | Remove `sort` param — Datadog Logs API does not support it |\n| `Invalid type for aggregate_request` | Span analytics schema violation | Use `datadog_search_traces` instead for basic trace search |\n\n## Security & Permissions\n\n- ClawLink stores only the OAuth token, never the raw API key\n- Device credentials are stored locally in OpenClaw plugin config\n- `datadog_list_api_keys` returns metadata only (no secret key values)\n- Datadog OAuth scopes are determined by ClawLink's registered app — user may need to reconnect if scopes change\n\n## Troubleshooting\n\n**Tools not showing up after install:**\n- Start a fresh OpenClaw chat to reload the plugin catalog\n- Call `clawlink_list_integrations` to confirm ClawLink is paired\n\n**\"Integration not connected\" error:**\n- Direct user to [claw-link.dev/dashboard?add=datadog](https://claw-link.dev/dashboard?add=datadog)\n- Confirm they complete the OAuth flow and approve the connection\n\n**Empty results from `datadog_list_events`:**\n- Events are often sparse — start with a broad time range and minimal filters\n- Combining multiple filters (tags + sources + priority) with narrow ranges may return empty results\n\n---\n\nPowered by [ClawLink](https://claw-link.dev) — your OpenClaw integration hub for Datadog.\n\nFile v0.1.2:_meta.json\n\n{\n \"ownerId\": \"kn713pxvayh8fjhb503zjb8yxh815j54\",\n \"slug\": \"datadog-monitoring\",\n \"version\": \"0.1.2\",\n \"publishedAt\": 1780841140825\n}\n\nFile v0.1.2:skill-card.md\n\n## Description:
\nInspect Datadog monitors, metrics, logs, incidents, dashboards, and observability data through ClawLink.
\n\nThis skill is ready for commercial/non-commercial use.
\n\n## Publisher:
\n[hith3sh](https://clawhub.ai/user/hith3sh)
\n\n### License/Terms of Use:
\nMIT-0
\n\n\n## Use Case:
\nDevelopers, SREs, and operations teams use this skill from OpenClaw to inspect Datadog observability data, investigate incidents, query logs and metrics, and create or update Datadog monitors, dashboards, downtimes, SLOs, and related resources.
\n\n### Deployment Geography for Use:
\nGlobal
\n\n## Known Risks and Mitigations:
\nRisk: The skill requires OAuth and routes Datadog observability data through ClawLink.
\nMitigation: Review the Datadog OAuth permissions and ClawLink routing model before installation, and connect only accounts whose observability data may be accessed through this integration.
\nRisk: Datadog logs, user and role listings, API-key metadata, webhooks, monitor changes, downtimes, and delete operations can expose or modify sensitive operational information.
\nMitigation: Treat read results as sensitive, limit use to authorized users, and approve write or delete actions only when the intended Datadog resource and change are clear.
\n\n\n## Reference(s):
\n- [ClawHub Datadog skill page](https://clawhub.ai/hith3sh/datadog-monitoring)
\n- [ClawLink](https://claw-link.dev)
\n- [ClawLink Datadog connection dashboard](https://claw-link.dev/dashboard?add=datadog)
\n\n\n## Skill Output:
\n**Output Type(s):** [guidance, shell commands, code, configuration, text]
\n**Output Format:** [Markdown with command snippets, JavaScript examples, and Datadog tool-call guidance.]
\n**Output Parameters:** [1D]
\n**Other Properties Related to Output:** [Requires ClawLink pairing and Datadog OAuth authorization before Datadog tools can be used.]
\n\n## Skill Version(s):
\n0.1.2 (source: server-resolved release metadata)
\n\n## Ethical Considerations:
\nUsers should evaluate whether this skill is appropriate for their environment, review any generated or modified files before relying on them, and apply their organization's safety, security, and compliance requirements before deployment.
\n\nArchive v0.1.1: 3 files, 4845 bytes\n\nFiles: skill-card.md (2252b), SKILL.md (10576b), _meta.json (137b)\n\nFile v0.1.1:SKILL.md\n\n---\nname: datadog-monitoring\ndescription: Inspect Datadog monitors, metrics, logs, incidents, dashboards, and observability data - powered by ClawLink.\n---\n\n# Datadog\n\nWork with Datadog from chat - inspect monitors, metrics, logs, incidents, dashboards, and observability data.\n\nPowered by [ClawLink](https://claw-link.dev), an integration hub for OpenClaw that handles hosted connection flows and credentials so you don't need to configure Datadog API access yourself.\n\n## Connection flow\n\n```\nUser → ClawLink OAuth → Datadog account\n ↓\n OpenClaw tools\n (via ClawLink)\n```\n\n**Step 1** — Install the ClawLink plugin:\n```\nopenclaw plugins install clawhub:clawlink-plugin\n```\nStart a fresh chat after installing.\n\n**Step 2** — Pair ClawLink:\n1. Call `clawlink_begin_pairing`\n2. Open the returned URL in your browser\n3. Sign in to ClawLink and approve the device\n\n**Step 3** — Connect Datadog:\nOpen [claw-link.dev/dashboard?add=datadog](https://claw-link.dev/dashboard?add=datadog), complete the OAuth flow, then confirm.\n\n*App-specific connection GIF coming soon*\n\n**Step 4** — Verify and discover:\n```javascript\n// 1. Verify Datadog is connected\nclawlink_list_integrations()\n\n// 2. List available tools\nclawlink_list_tools({ integration: \"datadog\" })\n\n// 3. Search tools if needed\nclawlink_search_tools({ query: \"monitor\", integration: \"datadog\" })\n```\n\n## Architecture\n\n```\n┌─────────────────────────────────────────────────────────┐\n│ OpenClaw (you) │\n├─────────────────────────────────────────────────────────┤\n│ ClawLink Plugin → clawlink_* tools │\n├─────────────────────────────────────────────────────────┤\n│ ClawLink Cloud │\n│ (credentials, connection state, routing) │\n├─────────────────────────────────────────────────────────┤\n│ Datadog API (user's account) │\n└─────────────────────────────────────────────────────────┘\n```\n\n## Tool reference\n\n### Read operations\n\n| Tool | Description | Risk |\n|------|-------------|------|\n| `datadog_get_dashboard` | Get detailed dashboard info including widgets, layout, template variables | safe |\n| `datadog_get_monitor` | Get monitor details, current state, configuration, active downtimes | safe |\n| `datadog_get_service_dependencies` | Get APM service dependency graph (upstream/downstream services) | safe |\n| `datadog_get_synthetics_locations` | List all available public/private synthetic test locations | safe |\n| `datadog_get_tags` | Get all tags associated with a specific host | safe |\n| `datadog_get_usage_summary` | Get usage summary (API calls, hosts, containers, billing metrics) | safe |\n| `datadog_list_all_tags` | List all tags in use across the organization | safe |\n| `datadog_list_api_keys` | List all API keys (names, owners, last-used timestamps) | safe |\n| `datadog_list_apm_services` | List APM services for application performance monitoring | safe |\n| `datadog_list_aws_integration` | List configured AWS account integrations | safe |\n| `datadog_list_dashboards` | List all dashboards with basic info | safe |\n| `datadog_list_events` | List events within a time range (deployments, outages, changes) | safe |\n| `datadog_list_hosts` | List all hosts with metrics, tags, and status | safe |\n| `datadog_list_incidents` | List incidents with timeline and impact tracking | safe |\n| `datadog_list_log_indexes` | List all log indexes (use before searching logs) | safe |\n| `datadog_list_metrics` | Discover active metric names since a given timestamp | safe |\n| `datadog_list_monitors` | Get all monitor details with filtering by group, name, tags | safe |\n| `datadog_list_roles` | List organization roles and their permissions | safe |\n| `datadog_list_service_checks` | List service check statuses for infrastructure components | safe |\n| `datadog_list_sl_os` | List Service Level Objectives and reliability targets | safe |\n| `datadog_list_synthetics` | List synthetic API tests from multiple global locations | safe |\n| `datadog_list_users` | List team members, their roles, and access levels | safe |\n| `datadog_list_webhooks` | List configured webhook integrations | safe |\n| `datadog_query_metrics` | Query time series metric data for custom dashboards/reports | safe |\n| `datadog_search_logs` | Search logs with advanced filtering (time in ms, no sort param) | safe |\n| `datadog_search_spans_analytics` | Analyze span data with aggregations (error rates, latency patterns) | safe |\n| `datadog_search_traces` | Search distributed traces across services | safe |\n\n### Write operations\n\n| Tool | Description | Risk |\n|------|-------------|------|\n| `datadog_create_dashboard` | Create a customizable monitoring dashboard | confirm |\n| `datadog_create_downtime` | Suppress alerts during maintenance windows | confirm |\n| `datadog_create_event` | Track deployments, outages, configuration changes | confirm |\n| `datadog_create_monitor` | Create a monitor with alerting thresholds and notifications | confirm |\n| `datadog_create_slo` | Create a Service Level Objective for reliability tracking | confirm |\n| `datadog_create_synthetic_api_test` | Create a synthetic API test from multiple global locations | confirm |\n| `datadog_create_webhook` | Register a webhook endpoint for monitor notifications | confirm |\n| `datadog_delete_dashboard` | Permanently remove a dashboard | high_impact |\n| `datadog_delete_monitor` | Permanently delete a monitor | high_impact |\n| `datadog_mute_monitor` | Temporarily silence alerts (maintenance windows) | confirm |\n| `datadog_submit_metrics` | Submit custom metrics and business KPIs | confirm |\n| `datadog_unmute_monitor` | Re-enable alerts from a previously muted monitor | confirm |\n| `datadog_update_dashboard` | Update dashboard configuration, widgets, or layout | confirm |\n| `datadog_update_host_tags` | Replace all tags on a specific host | confirm |\n| `datadog_update_monitor` | Update monitor thresholds or notification settings | confirm |\n\n## Code examples\n\n### Example 1: List all monitors and find critical ones\n\n```javascript\n// Get all monitors\nconst monitors = await clawlink_call_tool({\n tool: \"clawlink_list_tools\",\n parameters: { integration: \"datadog\" }\n});\n\n// Then get details for a specific monitor\nconst monitor = await clawlink_call_tool({\n tool: \"datadog_get_monitor\",\n parameters: { monitor_id: \"123456\" }\n});\n\n// Or list all monitors with details\nconst allMonitors = await clawlink_call_tool({\n tool: \"datadog_list_monitors\",\n parameters: {}\n});\n```\n\n### Example 2: Query metrics and search logs\n\n```javascript\n// List available metrics first\nconst metrics = await clawlink_call_tool({\n tool: \"datadog_list_metrics\",\n parameters: { from: 1704067200 }\n});\n\n// Query specific metrics\nconst timeseries = await clawlink_call_tool({\n tool: \"datadog_query_metrics\",\n parameters: {\n query: \"system.cpu.user{*}\",\n from: 1704067200,\n to: 1704153600\n }\n});\n\n// Search logs for errors\nconst errors = await clawlink_call_tool({\n tool: \"datadog_search_logs\",\n parameters: {\n query: \"status:error\",\n from: 1704067200000,\n to: 1704153600000\n }\n});\n```\n\n### Example 3: Create and manage monitors\n\n```javascript\n// Create a monitor\nconst newMonitor = await clawlink_call_tool({\n tool: \"datadog_create_monitor\",\n parameters: {\n name: \"High CPU Alert\",\n type: \"metric alert\",\n query: \"avg(last_5m):system.cpu.user{*} > 90\",\n message: \"CPU usage is above 90%\"\n }\n});\n\n// Mute a monitor during maintenance\nawait clawlink_call_tool({\n tool: \"datadog_mute_monitor\",\n parameters: {\n monitor_id: \"123456\",\n scope: \"env:production\"\n }\n});\n```\n\n### Example 4: Investigate an incident\n\n```javascript\n// List recent incidents\nconst incidents = await clawlink_call_tool({\n tool: \"datadog_list_incidents\",\n parameters: {}\n});\n\n// Get service dependencies for the affected service\nconst deps = await clawlink_call_tool({\n tool: \"datadog_get_service_dependencies\",\n parameters: { service_name: \"payment-service\" }\n});\n\n// Search traces for errors\nconst traces = await clawlink_call_tool({\n tool: \"datadog_search_traces\",\n parameters: { service: \"payment-service\", status: \"error\" }\n});\n```\n\n## Error handling\n\n| Error pattern | Likely cause | Resolution |\n|---------------|--------------|------------|\n| `Monitor not found` | Wrong monitor ID | Call `datadog_list_monitors` to get correct ID |\n| `Permission denied` | Missing Datadog scopes | User may need to reconnect Datadog with full permissions |\n| `Too many results` | Large time range | Narrow the time range or add filters to reduce result size |\n| `Sort parameter not supported` | Using `sort` in log search | Remove `sort` param — Datadog Logs API does not support it |\n| `Invalid type for aggregate_request` | Span analytics schema violation | Use `datadog_search_traces` instead for basic trace search |\n\n## Security & Permissions\n\n- ClawLink stores only the OAuth token, never the raw API key\n- Device credentials are stored locally in OpenClaw plugin config\n- `datadog_list_api_keys` returns metadata only (no secret key values)\n- Datadog OAuth scopes are determined by ClawLink's registered app — user may need to reconnect if scopes change\n\n## Troubleshooting\n\n**Tools not showing up after install:**\n- Start a fresh OpenClaw chat to reload the plugin catalog\n- Call `clawlink_list_integrations` to confirm ClawLink is paired\n\n**\"Integration not connected\" error:**\n- Direct user to [claw-link.dev/dashboard?add=datadog](https://claw-link.dev/dashboard?add=datadog)\n- Confirm they complete the OAuth flow and approve the connection\n\n**Empty results from `datadog_list_events`:**\n- Events are often sparse — start with a broad time range and minimal filters\n- Combining multiple filters (tags + sources + priority) with narrow ranges may return empty results\n\n---\n\nPowered by [ClawLink](https://claw-link.dev) — your OpenClaw integration hub for Datadog.\n\nFile v0.1.1:_meta.json\n\n{\n \"ownerId\": \"kn713pxvayh8fjhb503zjb8yxh815j54\",\n \"slug\": \"datadog-monitoring\",\n \"version\": \"0.1.1\",\n \"publishedAt\": 1780838882857\n}\n\nFile v0.1.1:skill-card.md\n\n## Description:
\nInspect Datadog monitors, metrics, logs, incidents, dashboards, and observability data - powered by ClawLink.
\n\nThis skill is ready for commercial/non-commercial use.
\n\n## Publisher:
\n[hith3sh](https://clawhub.ai/user/hith3sh)
\n\n### License/Terms of Use:
\nMIT-0
\n\n\n## Use Case:
\nDevelopers and operations teams use this skill to inspect and manage Datadog monitors, metrics, logs, incidents, dashboards, and related observability resources from an agent chat.
\n\n### Deployment Geography for Use:
\nGlobal
\n\n## Known Risks and Mitigations:
\nRisk: The skill requires OAuth access to a Datadog account and may expose sensitive observability metadata.
\nMitigation: Install only when comfortable granting ClawLink access to Datadog and review OAuth scopes before pairing.
\nRisk: Write operations can delete dashboards or monitors, mute alerts, change host tags, submit metrics, or create webhooks.
\nMitigation: Require explicit confirmation for write operations and review target IDs, scopes, and payloads before execution.
\nRisk: Missing or changed Datadog OAuth scopes can cause permission errors.
\nMitigation: Reconnect Datadog through ClawLink when scopes change or permissions are insufficient.
\n\n\n## Reference(s):
\n- [Datadog skill listing](https://clawhub.ai/hith3sh/datadog-monitoring)
\n- [ClawLink](https://claw-link.dev)
\n- [Connect Datadog in ClawLink](https://claw-link.dev/dashboard?add=datadog)
\n\n\n## Skill Output:
\n**Output Type(s):** [text, markdown, code, shell commands, configuration, guidance]
\n**Output Format:** [Markdown guidance with shell commands and JavaScript examples]
\n**Output Parameters:** [1D]
\n**Other Properties Related to Output:** [Requires ClawLink pairing and Datadog OAuth authorization; write operations should be confirmed before execution.]
\n\n## Skill Version(s):
\n0.1.1 (source: server release metadata)
\n\n## Ethical Considerations:
\nUsers should evaluate whether this skill is appropriate for their environment, review any generated or modified files before relying on them, and apply their organization's safety, security, and compliance requirements before deployment.
\n\nArchive v0.1.0: 3 files, 3486 bytes\n\nFiles: skill-card.md (2407b), SKILL.md (4910b), _meta.json (137b)\n\nFile v0.1.0:SKILL.md\n\n---\nname: datadog-monitoring\ndescription: Inspect Datadog monitors, metrics, logs, incidents, dashboards, and observability data - powered by ClawLink.\n---\n\n# Datadog\n\nWork with Datadog from chat - inspect monitors, metrics, logs, incidents, dashboards, and observability data.\n\nPowered by [ClawLink](https://claw-link.dev), an integration hub for OpenClaw that handles hosted connection flows and credentials so you don't need to configure Datadog API access yourself.\n\n## Quick start\n\n1. Install the verified ClawLink plugin: `openclaw plugins install clawhub:clawlink-plugin`\n2. Start a fresh OpenClaw chat if the plugin was just installed and ClawLink tools are not visible yet\n3. If ClawLink is not configured, call `clawlink_begin_pairing`\n4. Tell the user to open the returned pairing URL, sign in to ClawLink if needed, and approve the device\n5. After the user confirms approval, call `clawlink_get_pairing_status`\n6. Tell the user to connect Datadog at [claw-link.dev/dashboard?add=datadog](https://claw-link.dev/dashboard?add=datadog)\n7. When the user confirms Datadog is connected, call `clawlink_list_integrations` and then `clawlink_list_tools` with the `datadog` integration slug\n\n## Setup details\n\n### Installing the plugin\n\nIf the ClawLink plugin is not installed yet, tell the user to run:\n\n```\nopenclaw plugins install clawhub:clawlink-plugin\n```\n\nIf the current chat started before the plugin was installed and ClawLink tools are still unavailable, tell the user to start a fresh chat so OpenClaw reloads the plugin tool catalog.\n\n### Pairing ClawLink\n\nIf ClawLink reports that the plugin is not configured, the plugin has not been paired with the user's ClawLink account yet.\n\n1. Call `clawlink_begin_pairing`.\n2. Tell the user to open the returned pairing URL in their browser.\n3. The user signs in to ClawLink if needed and approves the OpenClaw device.\n4. After the user confirms approval, call `clawlink_get_pairing_status` to finish local setup.\n\nThe resulting device credential is stored locally in OpenClaw's plugin config and is only sent to `claw-link.dev`. The user should not paste raw credentials into chat.\n\n### Connecting Datadog\n\nTell the user to open https://claw-link.dev/dashboard?add=datadog and connect Datadog there. The page opens the add-connection panel filtered to Datadog. ClawLink's hosted page runs the provider connection flow. When they confirm it is done, call `clawlink_list_integrations` to verify, then call `clawlink_list_tools` with integration `datadog`.\n\n## Using Datadog tools\n\nClawLink provides tools dynamically based on what the user has connected. You do not need to know tool names or schemas in advance.\n\n### Discovery\n\n1. Call `clawlink_list_integrations` to confirm Datadog is connected.\n2. Call `clawlink_list_tools` with integration `datadog`.\n3. Treat the returned list as the source of truth. Do not guess or assume what tools exist.\n4. If the user describes a capability but the exact tool is unclear, call `clawlink_search_tools` with a short query and integration `datadog`.\n5. If no Datadog tools appear, direct the user to https://claw-link.dev/dashboard?add=datadog.\n\n### Execution\n\n1. Call `clawlink_describe_tool` before using an unfamiliar tool, before any write, or when the request is ambiguous.\n2. Use the returned schema, `whenToUse`, `askBefore`, `safeDefaults`, `examples`, and `followups`.\n3. Prefer read, list, search, and get operations before writes.\n4. For writes or anything marked as requiring confirmation, call `clawlink_preview_tool` first, then confirm with the user.\n5. Execute with `clawlink_call_tool`.\n6. If it fails, report the real error. Do not invent results or restate the failure as a missing capability unless the live catalog supports that conclusion.\n\n## What you can do\n\nTypical Datadog tasks (actual availability depends on the user's connected account, permissions, scopes, and current ClawLink tool catalog):\n\n- List and inspect monitors\n- Query metrics, logs, events, and traces when available\n- Review dashboards and service health\n- Create or update monitors after confirmation\n- Investigate incidents and alerts\n\n## Rules\n\n- Always use ClawLink tools for Datadog. Do not ask the user for separate Datadog credentials.\n- Do not claim a capability is missing without checking the live ClawLink catalog in the current turn.\n- Do not invent slash commands or ask the user to paste raw credentials.\n- Ask for confirmation before destructive, external-facing, or bulk write actions.\n- If Datadog is not connected, direct the user to https://claw-link.dev/dashboard?add=datadog.\n- Never echo or repeat the user's ClawLink credential.\n\n## Resources\n\n- ClawLink: https://claw-link.dev\n- ClawLink Docs: https://docs.claw-link.dev/openclaw\n- ClawLink Verification: https://claw-link.dev/verify\n- ClawLink Source: https://github.com/hith3sh/clawlink\n- Datadog API: https://docs.datadoghq.com/api/latest/\n\nFile v0.1.0:_meta.json\n\n{\n \"ownerId\": \"kn713pxvayh8fjhb503zjb8yxh815j54\",\n \"slug\": \"datadog-monitoring\",\n \"version\": \"0.1.0\",\n \"publishedAt\": 1778945663148\n}\n\nFile v0.1.0:skill-card.md\n\n## Description:
\nInspect Datadog monitors, metrics, logs, incidents, dashboards, and observability data - powered by ClawLink.
\n\nThis skill is ready for commercial/non-commercial use.
\n\n## Publisher:
\n[hith3sh](https://clawhub.ai/user/hith3sh)
\n\n### License/Terms of Use:
\nMIT-0
\n\n\n## Use Case:
\nDevelopers and operators use this skill to inspect Datadog observability data from chat, discover available ClawLink Datadog tools, and perform monitor or incident workflows with confirmation for write actions.
\n\n### Deployment Geography for Use:
\nGlobal
\n\n## Known Risks and Mitigations:
\nRisk: Datadog write, destructive, external-facing, or bulk actions can change monitoring behavior.
\nMitigation: Preview such actions through ClawLink and get explicit user confirmation before execution.
\nRisk: Credential exposure could occur if users paste Datadog or ClawLink secrets into chat.
\nMitigation: Use the ClawLink pairing and hosted connection flow, connect Datadog with least required permissions, and do not ask users to paste raw credentials.
\nRisk: Available Datadog capabilities depend on the connected account, granted scopes, and current ClawLink catalog.
\nMitigation: Discover integrations and tools in the current turn, describe unfamiliar tools before use, and report live errors without inventing unsupported capabilities.
\n\n\n## Reference(s):
\n- [ClawLink](https://claw-link.dev)
\n- [ClawLink Docs](https://docs.claw-link.dev/openclaw)
\n- [ClawLink Verification](https://claw-link.dev/verify)
\n- [ClawLink Source](https://github.com/hith3sh/clawlink)
\n- [Datadog API](https://docs.datadoghq.com/api/latest/)
\n\n\n## Skill Output:
\n**Output Type(s):** [Guidance, Shell commands, API Calls, Configuration]
\n**Output Format:** [Markdown with inline shell commands and tool-call guidance]
\n**Output Parameters:** [1D]
\n**Other Properties Related to Output:** [Uses live ClawLink Datadog tool schemas and previews write actions before execution.]
\n\n## Skill Version(s):
\n0.1.0 (source: release evidence)
\n\n## Ethical Considerations:
\nUsers should evaluate whether this skill is appropriate for their environment, review any generated or modified files before relying on them, and apply their organization's safety, security, and compliance requirements before deployment.
","readmeExcerpt":"Skill: Datadog Owner: hith3sh Summary: Inspect Datadog monitors, metrics, logs, incidents, dashboards, and observability data - powered by ClawLink. Tags: clawlink:0.1.0, integration:0.1.0, latest:1.0.6 Version history: v1.0.6 | 2026-06-09T07:06:00.637Z | user Add UTM attribution tags (utm_source=clawhub) to ClawLink branding links so visits from this skill page are tracked as a distinct traffic source. v1.0.5 | 2026","codeSnippets":[],"executableExamples":[{"language":"text","snippet":"User → ClawLink OAuth → Datadog account\n ↓\n OpenClaw tools\n (via ClawLink)"},{"language":"text","snippet":"openclaw plugins install clawhub:clawlink-plugin"},{"language":"javascript","snippet":"// 1. Verify Datadog is connected\nclawlink_list_integrations()\n\n// 2. List available tools\nclawlink_list_tools({ integration: \"datadog\" })\n\n// 3. Search tools if needed\nclawlink_search_tools({ query: \"monitor\", integration: \"datadog\" })"},{"language":"text","snippet":"┌─────────────────────────────────────────────────────────┐\n│ OpenClaw (you) │\n├─────────────────────────────────────────────────────────┤\n│ ClawLink Plugin → clawlink_* tools │\n├─────────────────────────────────────────────────────────┤\n│ ClawLink Cloud │\n│ (credentials, connection state, routing) │\n├─────────────────────────────────────────────────────────┤\n│ Datadog API (user's account) │\n└─────────────────────────────────────────────────────────┘"},{"language":"javascript","snippet":"// Get all monitors\nconst monitors = await clawlink_call_tool({\n tool: \"clawlink_list_tools\",\n parameters: { integration: \"datadog\" }\n});\n\n// Then get details for a specific monitor\nconst monitor = await clawlink_call_tool({\n tool: \"datadog_get_monitor\",\n parameters: { monitor_id: \"123456\" }\n});\n\n// Or list all monitors with details\nconst allMonitors = await clawlink_call_tool({\n tool: \"datadog_list_monitors\",\n parameters: {}\n});"},{"language":"javascript","snippet":"// List available metrics first\nconst metrics = await clawlink_call_tool({\n tool: \"datadog_list_metrics\",\n parameters: { from: 1704067200 }\n});\n\n// Query specific metrics\nconst timeseries = await clawlink_call_tool({\n tool: \"datadog_query_metrics\",\n parameters: {\n query: \"system.cpu.user{*}\",\n from: 1704067200,\n to: 1704153600\n }\n});\n\n// Search logs for errors\nconst errors = await clawlink_call_tool({\n tool: \"datadog_search_logs\",\n parameters: {\n query: \"status:error\",\n from: 1704067200000,\n to: 1704153600000\n }\n});"}],"parameters":null,"dependencies":[],"permissions":[],"extractedFiles":[{"path":"SKILL.md","content":"---\nname: datadog-monitoring\ndescription: Inspect Datadog monitors, metrics, logs, incidents, dashboards, and observability data - powered by ClawLink.\n---\n\n# Datadog\n\n\n\nWork with Datadog from chat - inspect monitors, metrics, logs, incidents, dashboards, and observability data.\n\nPowered by [ClawLink](https://claw-link.dev/?utm_source=clawhub&utm_medium=referral&utm_content=datadog-monitoring), an integration hub for OpenClaw that handles hosted connection flows and credentials so you don't need to configure Datadog API access yourself.\n\n### Setup in 3 Steps\n\n| Step 1: Install | Step 2: Pair Account | Step 3: Connect Datadog |\n|:---:|:---:|:---:|\n|  |  | *App-specific connection GIF coming soon* |\n| Run the install command in OpenClaw | Sign in and approve the device | Open the dashboard and connect Datadog |\n\n## Connection flow\n\n```\nUser → ClawLink OAuth → Datadog account\n ↓\n OpenClaw tools\n (via ClawLink)\n```\n\n**Step 1** — Install the ClawLink plugin:\n```\nopenclaw plugins install clawhub:clawlink-plugin\n```\nStart a fresh chat after installing.\n\n**Step 2** — Pair ClawLink:\n1. Call `clawlink_begin_pairing`\n2. Open the returned URL in your browser\n3. Sign in to ClawLink and approve the device\n\n**Step 3** — Connect Datadog:\nOpen [claw-link.dev/dashboard?add=datadog](https://claw-link.dev/dashboard?add=datadog), complete the OAuth flow, then confirm.\n\n*App-specific connection GIF coming soon*\n\n**Step 4** — Verify and discover:\n```javascript\n// 1. Verify Datadog is connected\nclawlink_list_integrations()\n\n// 2. List available tools\nclawlink_list_tools({ integration: \"datadog\" })\n\n// 3. Search tools if needed\nclawlink_search_tools({ query: \"monitor\", integration: \"datadog\" })\n```\n\n## Architecture\n\n```\n┌─────────────────────────────────────────────────────────┐\n│ OpenClaw (you) │\n├─────────────────────────────────────────────────────────┤\n│ ClawLink Plugin → clawlink_* tools │\n├─────────────────────────────────────────────────────────┤\n│ ClawLink Cloud │\n│ (credentials, connection state, routing) │\n├─────────────────────────────────────────────────────────┤\n│ Datadog API (user's account) │\n└─────────────────────────────────────────────────────────┘\n```\n\n## Tool reference\n\n### Read operations\n\n| Tool | Description | Risk |\n|------|-------------|------|\n| `datadog_get_dashboard` | Get detailed dashboard info including widgets, layout, template variables | safe |\n| `datadog_get_monitor` | Get monitor details, current state, configuration, active downtimes | safe |\n| `datadog_get_s"},{"path":"_meta.json","content":"{\n \"ownerId\": \"kn713pxvayh8fjhb503zjb8yxh815j54\",\n \"slug\": \"datadog-monitoring\",\n \"version\": \"1.0.6\",\n \"publishedAt\": 1780988760637\n}"},{"path":"skill-card.md","content":"## Description:\n\nInspect Datadog monitors, metrics, logs, incidents, dashboards, and observability data - powered by ClawLink.\n\nThis skill is ready for commercial/non-commercial use.\n\n## Publisher:\n\n[hith3sh](https://clawhub.ai/user/hith3sh)\n\n### License/Terms of Use:\n\nMIT-0\n\n## Use Case:\n\nDevelopers and operations engineers use this skill to inspect and manage Datadog observability data from chat, including monitors, metrics, logs, incidents, dashboards, traces, and service dependencies.\n\n### Deployment Geography for Use:\n\nGlobal\n\n## Known Risks and Mitigations:\n\nRisk: The skill asks users to install an external ClawLink plugin and authorize Datadog access that may include sensitive reads and write operations.\n\nMitigation: Review the ClawLink plugin and requested Datadog OAuth scopes before installation; prefer a dedicated least-privilege Datadog account and avoid broad reconnects unless write operations are required.\n\nRisk: Datadog logs, traces, users, roles, API-key metadata, webhooks, incidents, monitors, and host data can contain confidential operational information.\n\nMitigation: Treat retrieved observability data as confidential and limit access to users and workspaces approved for that Datadog organization.\n\nRisk: Write tools can create, update, mute, unmute, or delete Datadog resources, including monitors and dashboards.\n\nMitigation: Require human confirmation for write and destructive operations, and verify target resource identifiers before execution.\n\n## Reference(s):\n\n- [ClawHub Datadog Skill Page](https://clawhub.ai/hith3sh/skills/datadog-monitoring)\n- [ClawLink](https://claw-link.dev/?utm_source=clawhub&utm_medium=referral&utm_content=datadog-monitoring)\n- [ClawLink Datadog Connection Dashboard](https://claw-link.dev/dashboard?add=datadog)\n\n## Skill Output:\n\n**Output Type(s):** [text, markdown, shell commands, configuration, guidance]\n\n**Output Format:** [Markdown with inline shell commands and tool-call examples]\n\n**Output Parameters:** [1D]\n\n**Other Properties Related to Output:** [May route requests through ClawLink tools connected to the user's Datadog account]\n\n## Skill Version(s):\n\n1.0.6 (source: server release metadata)\n\n## Ethical Considerations:\n\nUsers should evaluate whether this skill is appropriate for their environment, review any generated or modified files before relying on them, and apply their organization's safety, security, and compliance requirements before deployment."}],"languages":[],"docsSourceLabel":"CLAWHUB","editorialOverview":"Inspect Datadog monitors, metrics, logs, incidents, dashboards, and observability data - powered by ClawLink. Skill: Datadog Owner: hith3sh Summary: Inspect Datadog monitors, metrics, logs, incidents, dashboards, and observability data - powered by ClawLink. Tags: clawlink:0.1.0, integration:0.1.0, latest:1.0.6 Version history: v1.0.6 | 2026-06-09T07:06:00.637Z | user Add UTM attribution tags (utm_source=clawhub) to ClawLink branding links so visits from this skill page are tracked as a distinct traffic source. v1.0.5 | 2026","editorialQuality":{"score":100,"threshold":65,"status":"ready","wordCount":997,"uniquenessScore":53,"reasons":[]}},"media":{"evidence":{"source":"no-media","verified":false,"confidence":"low","updatedAt":"2026-10-09T11:56:34.198Z","emptyReason":"No screenshots, media assets, or demo links are available."},"primaryImageUrl":null,"mediaAssetCount":0,"assets":[],"demoUrl":null},"ownerResources":{"evidence":{"source":"unclaimed","verified":false,"confidence":"low","updatedAt":"2026-10-09T11:56:34.198Z","emptyReason":"This page has not been claimed by the agent owner."},"hasCustomPage":false,"customPageUpdatedAt":null,"customLinks":[],"structuredLinks":{"docsUrl":null,"demoUrl":null,"supportUrl":null,"pricingUrl":null,"statusUrl":null},"customPage":null},"relatedAgents":{"evidence":{"source":"protocol-neighbors","verified":false,"confidence":"medium","updatedAt":"2026-10-10T07:04:41.776Z","emptyReason":null},"items":[{"id":"8ebccd8e-3863-4187-8355-c3f14e1f9edf","entityType":"agent","canonicalPath":"/agent/iofficeai-aionui","slug":"iofficeai-aionui","name":"AionUi","description":"Free, local, open-source 24/7 Cowork app and OpenClaw for Gemini CLI, Claude Code, Codex, OpenCode, Qwen Code, Goose CLI, Auggie, and more | 🌟 Star if you like it!","url":"https://github.com/iOfficeAI/AionUi","homepage":"https://www.aionui.com","source":"GITHUB_REPOS","protocols":["MCP","OPENCLAW"],"capabilities":[],"safetyScore":100,"overallRank":70,"updatedAt":"2026-10-09T19:11:12.944Z","createdAt":"2026-02-25T03:38:16.584Z","downloads":null},{"id":"b917f68a-ebff-438e-84f8-3f4b2494c0bc","entityType":"agent","canonicalPath":"/agent/activepieces-activepieces","slug":"activepieces-activepieces","name":"activepieces","description":"AI Agents & MCPs & AI Workflow Automation • (~400 MCP servers for AI agents) • AI Automation / AI Agent with MCPs • AI Workflows & AI Agents • MCPs for AI Agents","url":"https://github.com/activepieces/activepieces","homepage":"https://www.activepieces.com","source":"GITHUB_REPOS","protocols":["OPENCLAW"],"capabilities":[],"safetyScore":100,"overallRank":70,"updatedAt":"2026-04-15T02:22:12.426Z","createdAt":"2026-02-25T03:38:12.412Z","downloads":null},{"id":"5cb26759-3a39-483f-94cf-276a98c13bb8","entityType":"agent","canonicalPath":"/agent/cherryhq-cherry-studio","slug":"cherryhq-cherry-studio","name":"cherry-studio","description":"AI productivity studio with smart chat, autonomous agents, and 300+ assistants. Unified access to frontier LLMs","url":"https://github.com/CherryHQ/cherry-studio","homepage":"https://cherry-ai.com","source":"GITHUB_REPOS","protocols":["MCP","OPENCLAW"],"capabilities":[],"safetyScore":100,"overallRank":70,"updatedAt":"2026-04-11T14:38:40.986Z","createdAt":"2026-02-25T03:38:19.379Z","downloads":null},{"id":"6f6582d0-5d76-4f0f-b81d-86520247950b","entityType":"agent","canonicalPath":"/agent/copilotkit-copilotkit","slug":"copilotkit-copilotkit","name":"CopilotKit","description":"The Frontend for Agents & Generative UI. React + Angular","url":"https://github.com/CopilotKit/CopilotKit","homepage":"https://docs.copilotkit.ai","source":"GITHUB_REPOS","protocols":["OPENCLAW"],"capabilities":[],"safetyScore":100,"overallRank":70,"updatedAt":"2026-03-25T09:50:57.846Z","createdAt":"2026-02-25T03:39:14.617Z","downloads":null}],"links":{"hub":"/agent","source":"/agent/source/clawhub","protocols":[{"label":"OpenClaw","href":"/agent/protocol/openclew"}]}}}