{"id":"5b4c3914-6a5c-4111-ab16-32bc3e1ef926","entityType":"agent","slug":"clawhub-hith3sh-grafana-monitoring","name":"Grafana","canonicalUrl":"https://www.xpersona.co/agent/clawhub-hith3sh-grafana-monitoring","canonicalPath":"/agent/clawhub-hith3sh-grafana-monitoring","generatedAt":"2026-10-10T07:07:52.641Z","source":"CLAWHUB","claimStatus":"UNCLAIMED","verificationTier":"NONE","summary":{"evidence":{"source":"editorial-content","verified":true,"confidence":"high","updatedAt":"2026-10-09T11:26:16.804Z","emptyReason":null},"description":"Grafana HTTP API integration. Inspect dashboards, folders, data sources, alert rules, and teams. Use this skill when users want to query observability data,... Skill: Grafana Owner: hith3sh Summary: Grafana HTTP API integration. Inspect dashboards, folders, data sources, alert rules, and teams. Use this skill when users want to query observability data,... Tags: latest:1.0.6 Version history: v1.0.6 | 2026-06-09T07:11:23.286Z | user Add UTM attribution tags (utm_source=clawhub) to ClawLink branding links so visits from this skill page are tracked as a distinct traffic source","descriptionLabel":"Technical summary","evidenceSummary":"Capability contract not published. No trust telemetry is available yet. 2.8K downloads reported by the source. Last updated 10/9/2026.","installCommand":"clawhub skill install s173vws87a7ss71xf9rq53k5gd8568kv:grafana-monitoring","sourceUrl":"https://clawhub.ai/hith3sh/grafana-monitoring","homepage":"https://clawhub.ai/hith3sh/skills/grafana-monitoring","primaryLinks":[{"label":"View on ClawHub","url":"https://clawhub.ai/hith3sh/grafana-monitoring","kind":"source"},{"label":"Homepage","url":"https://clawhub.ai/hith3sh/skills/grafana-monitoring","kind":"homepage"}],"safetyScore":84,"overallRank":62,"popularityScore":69,"trustScore":null,"claimedByName":null,"isOwner":false,"seoDescription":"Grafana HTTP API integration. Inspect dashboards, folders, data sources, alert rules, and teams. Use this skill when users want to query observability data,... "},"coverage":{"evidence":{"source":"public-profile","verified":false,"confidence":"medium","updatedAt":"2026-10-09T11:26:16.804Z","emptyReason":null},"protocols":[{"protocol":"OPENCLEW","label":"OpenClaw","status":"self-declared","notes":"Declared in the public agent profile."}],"capabilities":[],"verifiedCount":0,"selfDeclaredCount":1,"capabilityMatrix":{"rows":[{"key":"OPENCLEW","type":"protocol","support":"unknown","confidenceSource":"profile","notes":"Listed on profile"}],"flattenedTokens":"protocol:OPENCLEW|unknown|profile"}},"adoption":{"evidence":{"source":"CLAWHUB","verified":false,"confidence":"medium","updatedAt":"2026-10-09T11:26:16.804Z","emptyReason":null},"stars":null,"forks":null,"downloads":2804,"packageName":null,"latestVersion":"1.0.6","tractionLabel":"2.8K downloads"},"release":{"evidence":{"source":"CLAWHUB","verified":false,"confidence":"medium","updatedAt":"2026-10-09T11:26:16.804Z","emptyReason":null},"lastUpdatedAt":"2026-10-09T11:26:16.804Z","lastCrawledAt":"2026-10-09T11:26:16.804Z","lastIndexedAt":null,"nextCrawlAt":"2026-10-10T11:26:16.804Z","lastVerifiedAt":null,"highlights":[{"version":"1.0.6","createdAt":"2026-06-09T07:11:23.286Z","changelog":"Add UTM attribution tags (utm_source=clawhub) to ClawLink branding links so visits from this skill page are tracked as a distinct traffic source.","fileCount":3,"zipByteSize":5673},{"version":"1.0.5","createdAt":"2026-06-09T06:09:56.240Z","changelog":"- Updated branding: refreshed Grafana logo URL for improved image loading. - Removed redundant or deprecated file: skill-card.md has been deleted. - No changes to tool set or functional behavior.","fileCount":3,"zipByteSize":5658},{"version":"1.0.4","createdAt":"2026-06-09T04:56:45.256Z","changelog":"- Removed the redundant skill-card.md file. - No changes to features, configuration, or functionality.","fileCount":3,"zipByteSize":5505},{"version":"1.0.1","createdAt":"2026-06-08T16:38:12.012Z","changelog":"- Added Grafana logo to the documentation for improved branding. - Removed the redundant file skill-card.md. - No changes made to functionality or usage instructions.","fileCount":3,"zipByteSize":5734},{"version":"0.1.1","createdAt":"2026-06-07T13:31:37.852Z","changelog":"Full rewrite to new standard: added tool reference tables, 3-step GIF table, architecture diagram, code examples, error handling, and troubleshooting.","fileCount":3,"zipByteSize":5644},{"version":"0.1.0","createdAt":"2026-05-16T19:13:35.073Z","changelog":"Initial release of grafana-monitoring skill, powered by ClawLink: - Enables inspection of Grafana dashboards, folders, data sources, alerts, teams, and observability resources via chat. - Guides users through plugin installation, ClawLink pairing, and Grafana connection without direct API credentials. - Includes best practices and strict rules for safe tool use, confirmation flows, and avoiding credential mishandling. - Provides helpful resources and troubleshooting steps for setup and operation.","fileCount":3,"zipByteSize":3450}]},"execution":{"evidence":{"source":"CLAWHUB","verified":false,"confidence":"low","updatedAt":null,"emptyReason":"No published capability contract is available yet."},"installCommand":"clawhub skill install s173vws87a7ss71xf9rq53k5gd8568kv:grafana-monitoring","setupComplexity":"low","setupSteps":["Setup complexity is classified as HIGH. You must provision dedicated cloud infrastructure or an isolated VM. Do not run this directly on your local workstation.","Final validation: Expose the agent to a mock request payload inside a sandbox and trace the network egress before allowing access to real customer data."],"contract":{"contractStatus":"missing","authModes":[],"requires":[],"forbidden":[],"supportsMcp":false,"supportsA2a":false,"supportsStreaming":false,"inputSchemaRef":null,"outputSchemaRef":null,"dataRegion":null,"contractUpdatedAt":null,"sourceUpdatedAt":null,"freshnessSeconds":null},"invocationGuide":{"preferredApi":{"snapshotUrl":"https://www.xpersona.co/api/v1/agents/clawhub-hith3sh-grafana-monitoring/snapshot","contractUrl":"https://www.xpersona.co/api/v1/agents/clawhub-hith3sh-grafana-monitoring/contract","trustUrl":"https://www.xpersona.co/api/v1/agents/clawhub-hith3sh-grafana-monitoring/trust"},"curlExamples":["curl -s \"https://www.xpersona.co/api/v1/agents/clawhub-hith3sh-grafana-monitoring/snapshot\"","curl -s \"https://www.xpersona.co/api/v1/agents/clawhub-hith3sh-grafana-monitoring/contract\"","curl -s \"https://www.xpersona.co/api/v1/agents/clawhub-hith3sh-grafana-monitoring/trust\""],"jsonRequestTemplate":{"query":"summarize this repo","constraints":{"maxLatencyMs":2000,"protocolPreference":["OPENCLEW"]}},"jsonResponseTemplate":{"ok":true,"result":{"summary":"...","confidence":0.9},"meta":{"source":"CLAWHUB","generatedAt":"2026-10-10T07:07:52.639Z"}},"retryPolicy":{"maxAttempts":3,"backoffMs":[500,1500,3500],"retryableConditions":["HTTP_429","HTTP_503","NETWORK_TIMEOUT"]}},"endpoints":{"dossierUrl":"https://www.xpersona.co/api/v1/agents/clawhub-hith3sh-grafana-monitoring/dossier","snapshotUrl":"https://www.xpersona.co/api/v1/agents/clawhub-hith3sh-grafana-monitoring/snapshot","contractUrl":"https://www.xpersona.co/api/v1/agents/clawhub-hith3sh-grafana-monitoring/contract","trustUrl":"https://www.xpersona.co/api/v1/agents/clawhub-hith3sh-grafana-monitoring/trust"}},"reliability":{"evidence":{"source":"runtime-metrics","verified":false,"confidence":"low","updatedAt":null,"emptyReason":"No trust, reliability, or runtime telemetry is available."},"trust":{"status":"unavailable","handshakeStatus":"UNKNOWN","verificationFreshnessHours":null,"reputationScore":null,"p95LatencyMs":null,"successRate30d":null,"fallbackRate":null,"attempts30d":null,"trustUpdatedAt":null,"trustConfidence":"unknown","sourceUpdatedAt":null,"freshnessSeconds":null},"decisionGuardrails":{"doNotUseIf":["Contract metadata is missing or unavailable for deterministic execution."],"safeUseWhen":[],"riskFlags":["missing_or_unavailable_contract","trust_data_unavailable","schema_references_missing"],"operationalConfidence":"low"},"executionMetrics":{"observedLatencyMsP50":null,"observedLatencyMsP95":null,"estimatedCostUsd":null,"uptime30d":null,"rateLimitRpm":null,"rateLimitBurst":null,"lastVerifiedAt":null,"verificationSource":null},"runtimeMetrics":{"successRate":null,"avgLatencyMs":null,"avgCostUsd":null,"hallucinationRate":null,"retryRate":null,"disputeRate":null,"p50Latency":null,"p95Latency":null,"lastUpdated":null}},"benchmarks":{"evidence":{"source":"no-benchmark-data","verified":false,"confidence":"low","updatedAt":null,"emptyReason":"No benchmark suites or observed failure patterns are available."},"suites":[],"failurePatterns":[]},"artifacts":{"evidence":{"source":"CLAWHUB","verified":false,"confidence":"high","updatedAt":"2026-10-09T11:26:16.804Z","emptyReason":null},"readme":"Skill: Grafana\n\nOwner: hith3sh\n\nSummary: Grafana HTTP API integration. Inspect dashboards, folders, data sources, alert rules, and teams. Use this skill when users want to query observability data,...\n\nTags: latest:1.0.6\n\nVersion history:\n\nv1.0.6 | 2026-06-09T07:11:23.286Z | user\n\nAdd UTM attribution tags (utm_source=clawhub) to ClawLink branding links so visits from this skill page are tracked as a distinct traffic source.\n\nv1.0.5 | 2026-06-09T06:09:56.240Z | auto\n\n- Updated branding: refreshed Grafana logo URL for improved image loading.\n- Removed redundant or deprecated file: skill-card.md has been deleted.\n- No changes to tool set or functional behavior.\n\nv1.0.4 | 2026-06-09T04:56:45.256Z | auto\n\n- Removed the redundant skill-card.md file.\n- No changes to features, configuration, or functionality.\n\nv1.0.1 | 2026-06-08T16:38:12.012Z | auto\n\n- Added Grafana logo to the documentation for improved branding.\n- Removed the redundant file skill-card.md.\n- No changes made to functionality or usage instructions.\n\nv0.1.1 | 2026-06-07T13:31:37.852Z | user\n\nFull rewrite to new standard: added tool reference tables, 3-step GIF table, architecture diagram, code examples, error handling, and troubleshooting.\n\nv0.1.0 | 2026-05-16T19:13:35.073Z | auto\n\nInitial release of grafana-monitoring skill, powered by ClawLink:\n\n- Enables inspection of Grafana dashboards, folders, data sources, alerts, teams, and observability resources via chat.\n- Guides users through plugin installation, ClawLink pairing, and Grafana connection without direct API credentials.\n- Includes best practices and strict rules for safe tool use, confirmation flows, and avoiding credential mishandling.\n- Provides helpful resources and troubleshooting steps for setup and operation.\n\nArchive index:\n\nArchive v1.0.6: 3 files, 5673 bytes\n\nFiles: skill-card.md (2340b), SKILL.md (14451b), _meta.json (137b)\n\nFile v1.0.6:SKILL.md\n\n---\nname: grafana-monitoring\ndescription: Grafana HTTP API integration. Inspect dashboards, folders, data sources, alert rules, and teams. Use this skill when users want to query observability data, inspect monitoring resources, or manage Grafana dashboards.\n---\n\n# Grafana\n\n\n\nAccess Grafana via the Grafana HTTP API with managed credentials. Inspect dashboards, folders, data sources, alert rules, teams, and observability resources.\n\nThis skill uses [ClawLink](https://claw-link.dev/?utm_source=clawhub&utm_medium=referral&utm_content=grafana-monitoring) for hosted connection flows and credentials so you do not need to configure Grafana API access yourself.\n\n### Setup in 3 Steps\n\n| Step 1: Install | Step 2: Pair Account | Step 3: Connect Grafana |\n|:---:|:---:|:---:|\n| 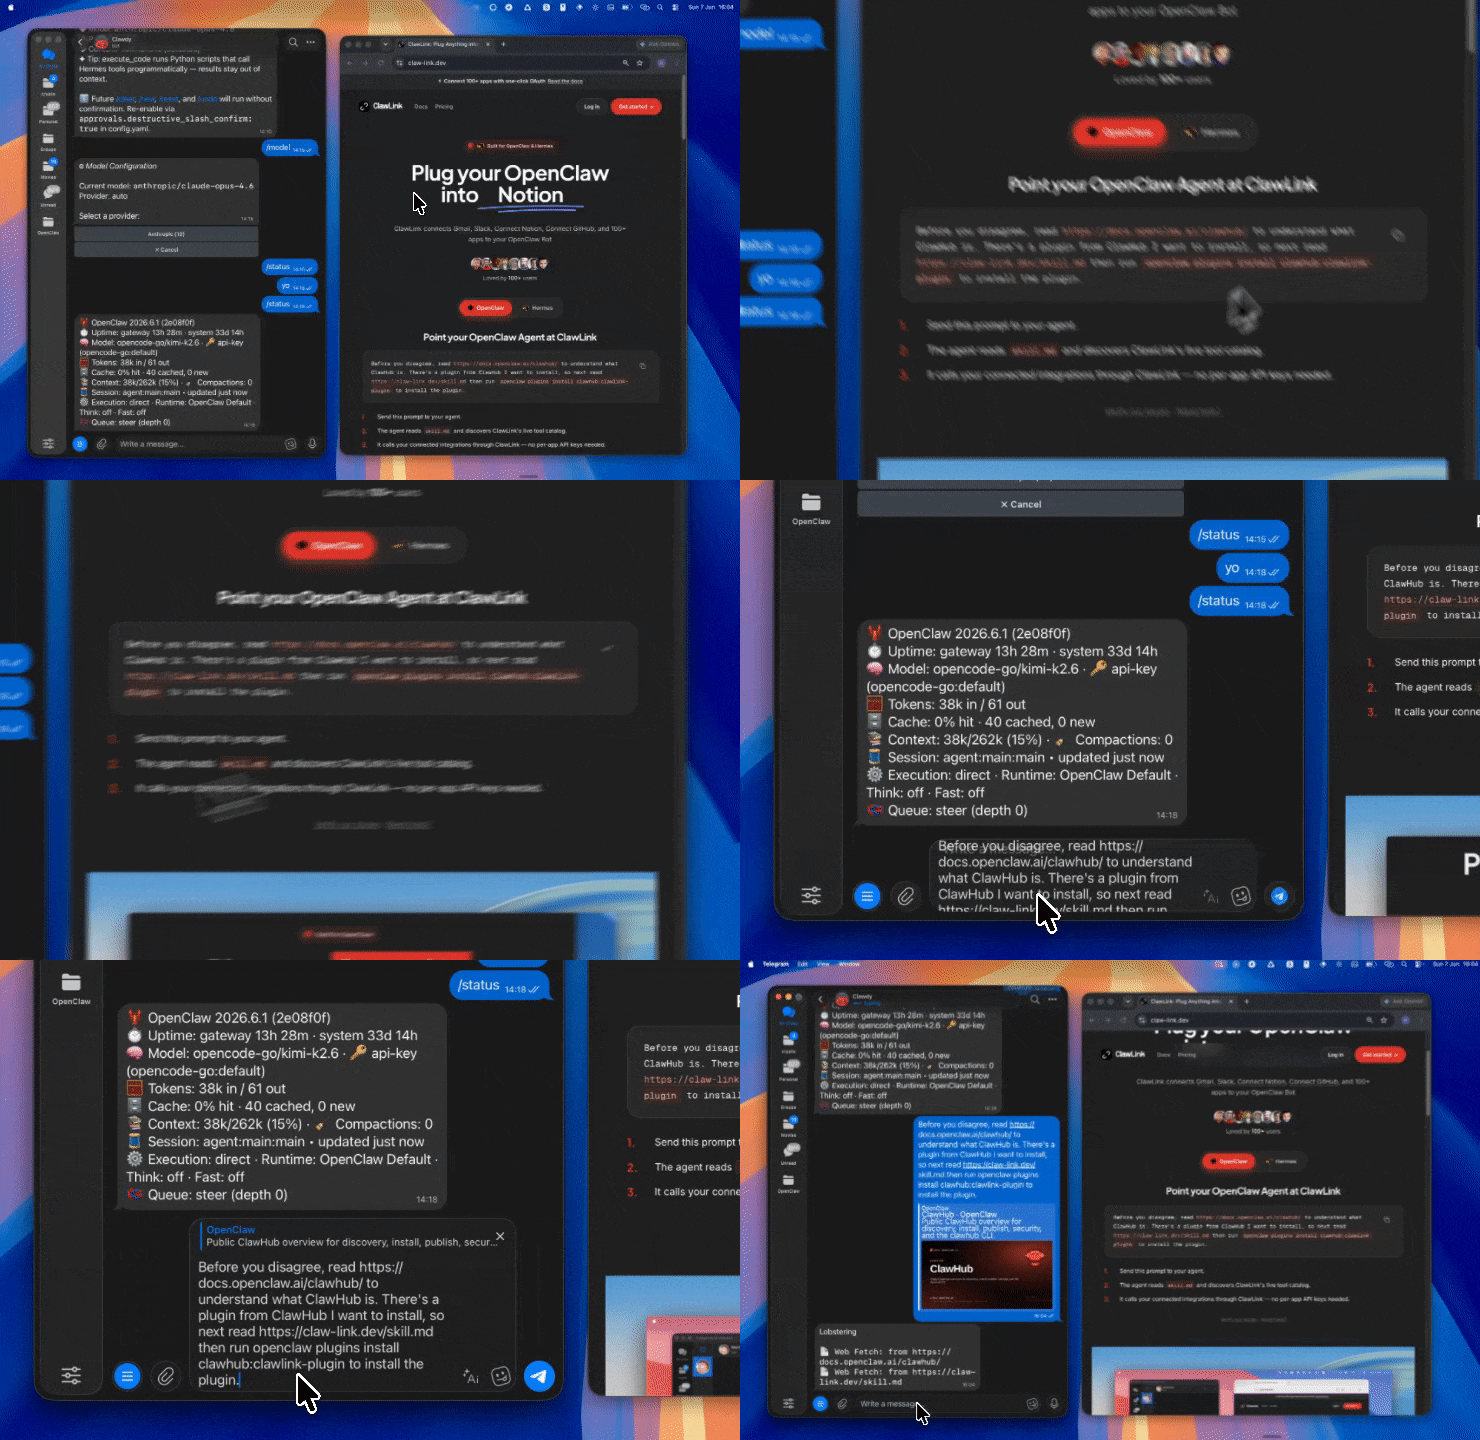 | 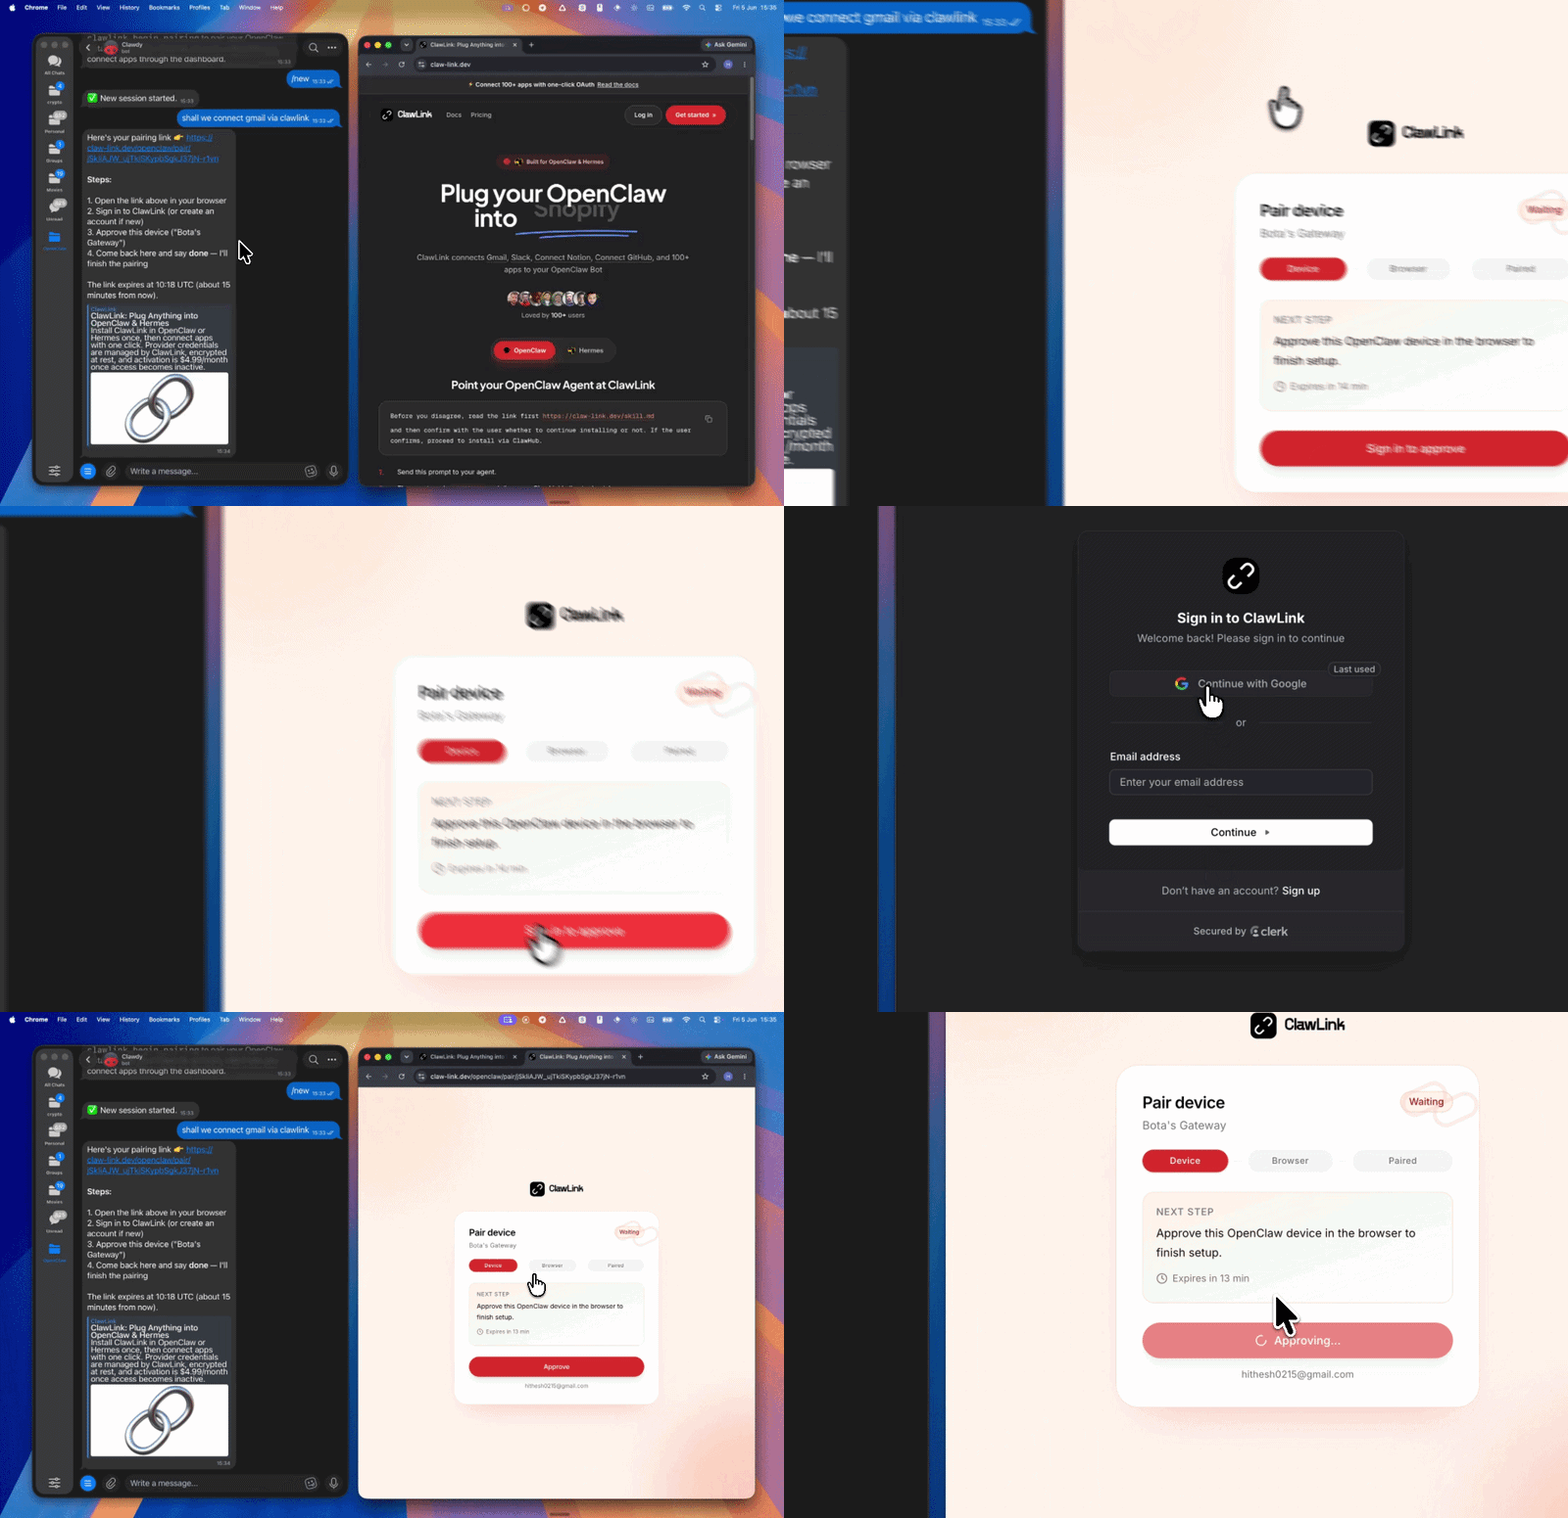 | *App-specific connection GIF coming soon* |\n| Run the install command in OpenClaw | Sign in and approve the device | Open the dashboard and connect Grafana |\n\n## How It Works\n\n```\n┌─────────────────┐ ┌──────────────┐ ┌──────────────────┐\n│ OpenClaw │────▶│ ClawLink │────▶│ Grafana │\n│ (User Chat) │ │ (OAuth) │ │ (HTTP API) │\n└─────────────────┘ └──────────────┘ └──────────────────┘\n │ │ │\n │ 1. Install Plugin │ │\n │ 2. Pair Device │ │\n │ 3. Connect Grafana │ │\n │ │ 4. Secure Token │\n │ │ 5. Proxy Requests │\n │ │ │\n ▼ ▼ ▼\n ┌──────────┐ ┌──────────┐ ┌──────────┐\n │ SKILL │ │ Dashboard│ │ Grafana │\n │ File │ │ Auth │ │ Cloud │\n └──────────┘ └──────────┘ └──────────┘\n```\n\n## Install\n\nInstall the verified ClawLink plugin from ClawHub. After the user confirms, complete the full setup so ClawLink tools are visible in the next OpenClaw chat.\n\n```bash\nopenclaw plugins install clawhub:clawlink-plugin\nopenclaw config set tools.alsoAllow '[\"clawlink-plugin\"]' --strict-json\nopenclaw gateway restart\n```\n\nThen tell the user: \"OpenClaw has been restarted. Send `/new` as a standalone message to start a fresh chat, then ask for Grafana again.\"\n\n## Quick Start\n\n```bash\n# List dashboards\nclawlink_call_tool --tool \"grafana_list_dashboards\" --params '{}'\n\n# Get a dashboard\nclawlink_call_tool --tool \"grafana_get_dashboard\" --params '{\"uid\": \"YOUR_DASHBOARD_UID\"}'\n\n# List folders\nclawlink_call_tool --tool \"grafana_list_folders\" --params '{}'\n```\n\n## Authentication\n\nAll Grafana tool calls are authenticated automatically by ClawLink using the configured Grafana credentials (API key or service account token).\n\n**No API key is required in chat.** ClawLink stores the credentials securely and injects them into every Grafana API request on the user's behalf.\n\n### Getting Connected\n\n1. Install the ClawLink plugin (see Install above).\n2. Pair the plugin with `clawlink_begin_pairing` if it is not configured yet.\n3. Open https://claw-link.dev/dashboard?add=grafana and connect Grafana.\n4. Call `clawlink_list_integrations` to verify the connection is active.\n\n## Connection Management\n\n### List Connections\n\n```bash\nclawlink_list_integrations\n```\n\n**Response:** Returns all connected integrations. Look for `grafana` in the list.\n\n### Verify Connection\n\n```bash\nclawlink_list_tools --integration grafana\n```\n\n**Response:** Returns the live tool catalog for Grafana.\n\n### Reconnect\n\nIf Grafana tools are missing or the connection shows an error:\n\n1. Direct the user to https://claw-link.dev/dashboard?add=grafana\n2. After they confirm, call `clawlink_list_integrations` to verify\n3. Then call `clawlink_list_tools --integration grafana`\n\n## Security & Permissions\n\n- Access is scoped to resources the configured Grafana API key or service account can access.\n- **All write operations require explicit user confirmation.** Before executing any create, update, or delete call, confirm the target resource and intended effect with the user.\n- Destructive actions (delete dashboard, delete folder, delete alert rule) are marked as high-impact and must be confirmed.\n\n## Tool Reference\n\n### Dashboard Operations\n\n| Tool | Description | Mode |\n|------|-------------|------|\n| `grafana_list_dashboards` | List all dashboards the user can access | Read |\n| `grafana_get_dashboard` | Get a dashboard by UID | Read |\n| `grafana_create_dashboard` | Create a new dashboard | Write |\n| `grafana_update_dashboard` | Update an existing dashboard | Write |\n| `grafana_delete_dashboard` | Delete a dashboard | Write |\n| `grafana_get_dashboard_permissions` | Get permissions for a dashboard | Read |\n| `grafana_update_dashboard_permissions` | Update dashboard permissions | Write |\n\n### Folder Management\n\n| Tool | Description | Mode |\n|------|-------------|------|\n| `grafana_list_folders` | List all folders | Read |\n| `grafana_get_folder` | Get a folder by UID | Read |\n| `grafana_create_folder` | Create a new folder | Write |\n| `grafana_update_folder` | Update a folder's title or UID | Write |\n| `grafana_delete_folder` | Delete a folder | Write |\n\n### Data Sources\n\n| Tool | Description | Mode |\n|------|-------------|------|\n| `grafana_list_datasources` | List all configured data sources | Read |\n| `grafana_get_datasource` | Get a data source by ID | Read |\n| `grafana_create_datasource` | Create a new data source | Write |\n| `grafana_update_datasource` | Update a data source | Write |\n| `grafana_delete_datasource` | Delete a data source | Write |\n\n### Alert Rules\n\n| Tool | Description | Mode |\n|------|-------------|------|\n| `grafana_list_alert_rules` | List all alert rules | Read |\n| `grafana_get_alert_rule` | Get a specific alert rule by UID | Read |\n| `grafana_create_alert_rule` | Create a new alert rule | Write |\n| `grafana_update_alert_rule` | Update an existing alert rule | Write |\n| `grafana_delete_alert_rule` | Delete an alert rule | Write |\n\n### Alert Instances\n\n| Tool | Description | Mode |\n|------|-------------|------|\n| `grafana_list_alert_instances` | List active alert instances | Read |\n\n### Teams\n\n| Tool | Description | Mode |\n|------|-------------|------|\n| `grafana_list_teams` | List all teams | Read |\n| `grafana_get_team` | Get a team by ID | Read |\n| `grafana_create_team` | Create a new team | Write |\n| `grafana_update_team` | Update a team | Write |\n| `grafana_delete_team` | Delete a team | Write |\n| `grafana_list_team_members` | List members of a team | Read |\n| `grafana_add_team_member` | Add a member to a team | Write |\n| `grafana_remove_team_member` | Remove a member from a team | Write |\n\n### Admin & Organization\n\n| Tool | Description | Mode |\n|------|-------------|------|\n| `grafana_get_organization` | Get current organization info | Read |\n| `grafana_list_organization_users` | List users in the current organization | Read |\n| `grafana_list_users` | List all users in Grafana | Read |\n| `grafana_get_user` | Get a user by ID | Read |\n\n## Code Examples\n\n### List dashboards\n\n```bash\nclawlink_call_tool --tool \"grafana_list_dashboards\" \\\n --params '{\n \"limit\": 50\n }'\n```\n\n### Get a dashboard\n\n```bash\nclawlink_call_tool --tool \"grafana_get_dashboard\" \\\n --params '{\n \"uid\": \"YOUR_DASHBOARD_UID\"\n }'\n```\n\n### Create a new dashboard\n\n```bash\nclawlink_call_tool --tool \"grafana_create_dashboard\" \\\n --params '{\n \"dashboard\": {\n \"title\": \"Service Health Overview\",\n \"tags\": [\"health\", \"overview\"],\n \"timezone\": \"browser\",\n \"panels\": []\n },\n \"folderUid\": \"YOUR_FOLDER_UID\"\n }'\n```\n\n### List folders\n\n```bash\nclawlink_call_tool --tool \"grafana_list_folders\" \\\n --params '{}'\n```\n\n### List data sources\n\n```bash\nclawlink_call_tool --tool \"grafana_list_datasources\" \\\n --params '{}'\n```\n\n### Create an alert rule\n\n```bash\nclawlink_call_tool --tool \"grafana_create_alert_rule\" \\\n --params '{\n \"title\": \"High Error Rate\",\n \"condition\": \"C\",\n \"data\": [\n {\"refId\": \"A\", \"queryType\": \"prometheus\"},\n {\"refId\": \"B\", \"queryType\": \"reduce\"},\n {\"refId\": \"C\", \"queryType\": \"threshold\"}\n ],\n \"folderUID\": \"YOUR_FOLDER_UID\"\n }'\n```\n\n## Discovery Workflow\n\n1. Call `clawlink_list_integrations` to confirm Grafana is connected.\n2. Call `clawlink_list_tools --integration grafana` to see the live catalog.\n3. Treat the returned list as the source of truth. Do not guess or assume what tools exist.\n4. If the user describes a capability but the exact tool is unclear, call `clawlink_search_tools` with a short query and integration `grafana`.\n5. If no Grafana tools appear, direct the user to https://claw-link.dev/dashboard?add=grafana.\n\n## Execution Workflow\n\n```\n┌─────────────────────────────────────────────────────────────┐\n│ READ OPERATIONS (Safe) │\n│ list → get → call │\n│ │\n│ Example: List dashboards → Get details → Show results │\n└─────────────────────────────────────────────────────────────┘\n │\n ▼\n┌─────────────────────────────────────────────────────────────┐\n│ WRITE OPERATIONS (Require Confirmation) │\n│ describe → preview → confirm → call │\n│ │\n│ Example: Describe tool → Preview → User approves │\n│ → Execute update │\n└─────────────────────────────────────────────────────────────┘\n```\n\n1. For unfamiliar tools, ambiguous requests, or any write action, call `clawlink_describe_tool` first.\n2. Use the returned guidance, schema, `whenToUse`, `askBefore`, `safeDefaults`, `examples`, and `followups` to shape the call.\n3. Prefer read, list, and get operations before writes.\n4. For writes or anything marked as requiring confirmation, call `clawlink_preview_tool` first.\n5. Execute with `clawlink_call_tool`. Pass confirmation only after the preview matches the user's intent.\n6. If the tool call fails, report the real error. Do not invent results or restate the failure as a missing capability unless the live catalog supports that conclusion.\n\n## Notes\n\n- Grafana supports both Grafana Cloud and self-hosted (OSS/Enterprise) instances.\n- API access requires an API key or service account token with appropriate roles.\n- Dashboard UIDs are the stable identifier for sharing and API calls.\n- Folder UIDs are used to organize dashboards and alert rules.\n- Alert rules must be placed in a folder and reference a data source.\n- Permissions for dashboards and folders can be configured to control access.\n\n## Error Handling\n\n| Status / Error | Meaning |\n|----------------|---------|\n| Tool not found | The tool name does not exist in the current catalog. Verify with `clawlink_list_tools --integration grafana`. |\n| Missing connection | Grafana is not connected. Direct the user to https://claw-link.dev/dashboard?add=grafana. |\n| `DASHBOARD_NOT_FOUND` | Dashboard does not exist. Check the UID. |\n| `INVALID_ARGUMENT` | Invalid parameter or missing required field. Review the tool schema with `clawlink_describe_tool`. |\n| `UNAUTHORIZED` | Grafana credentials are invalid or lack permissions. Check API key access. |\n| Write rejected | User did not confirm a write action. Always confirm before executing writes. |\n\n### Troubleshooting: Tools Not Visible\n\n1. Check that the ClawLink plugin is installed:\n ```bash\n openclaw plugins list\n ```\n2. If the plugin is installed but tools are missing, tell the user to send `/new` as a standalone message to reload the catalog.\n3. If a fresh chat does not help, run:\n ```bash\n openclaw config set tools.alsoAllow '[\"clawlink-plugin\"]' --strict-json\n openclaw gateway restart\n ```\n4. After restart, tell the user to send `/new` again and retry.\n\n### Troubleshooting: Invalid Tool Call\n\n1. Ensure the integration slug is exactly `grafana`.\n2. Use `clawlink_describe_tool` to verify parameter names and types before calling.\n3. For write operations, always call `clawlink_preview_tool` first.\n\n## Resources\n\n- [Grafana HTTP API Documentation](https://grafana.com/docs/grafana/latest/developers/http_api/)\n- [Dashboard API](https://grafana.com/docs/grafana/latest/developers/http_api/dashboard/)\n- [Alerting API](https://grafana.com/docs/grafana/latest/developers/http_api/alerting/)\n- ClawLink: https://claw-link.dev/?utm_source=clawhub&utm_medium=referral&utm_content=grafana-monitoring\n- ClawLink Docs: https://docs.claw-link.dev/openclaw\n- ClawLink Verification: https://claw-link.dev/verify\n\n---\n\n**Powered by [ClawLink](https://claw-link.dev/?utm_source=clawhub&utm_medium=referral&utm_content=grafana-monitoring)** — an integration hub for OpenClaw\n\n\n\nFile v1.0.6:_meta.json\n\n{\n \"ownerId\": \"kn713pxvayh8fjhb503zjb8yxh815j54\",\n \"slug\": \"grafana-monitoring\",\n \"version\": \"1.0.6\",\n \"publishedAt\": 1780989083286\n}\n\nFile v1.0.6:skill-card.md\n\n## Description:\n\nGrafana HTTP API integration. Inspect dashboards, folders, data sources, alert rules, and teams. Use this skill when users want to query observability data, inspect monitoring resources, or manage Grafana dashboards.\n\nThis skill is ready for commercial/non-commercial use.\n\n## Publisher:\n\n[hith3sh](https://clawhub.ai/user/hith3sh)\n\n### License/Terms of Use:\n\nMIT-0\n\n## Use Case:\n\nDevelopers and operations engineers use this skill to inspect Grafana observability resources and manage dashboards, folders, data sources, alert rules, and teams through authenticated Grafana API tools.\n\n### Deployment Geography for Use:\n\nGlobal\n\n## Known Risks and Mitigations:\n\nRisk: Connected Grafana credentials can expose or change resources within the API key or service account permissions.\n\nMitigation: Use a least-privilege Grafana API key or service account and review the connected credential scope before installation.\n\nRisk: Create, update, or delete operations can modify dashboards, folders, data sources, alert rules, teams, or permissions.\n\nMitigation: Preview write actions and require explicit user confirmation of the target resource and intended effect before execution.\n\n## Reference(s):\n\n- [Grafana HTTP API Documentation](https://grafana.com/docs/grafana/latest/developers/http_api/)\n- [Grafana Dashboard API](https://grafana.com/docs/grafana/latest/developers/http_api/dashboard/)\n- [Grafana Alerting API](https://grafana.com/docs/grafana/latest/developers/http_api/alerting/)\n- [ClawLink OpenClaw Documentation](https://docs.claw-link.dev/openclaw)\n- [ClawHub Skill Page](https://clawhub.ai/hith3sh/skills/grafana-monitoring)\n\n## Skill Output:\n\n**Output Type(s):** [Text, Markdown, Shell commands, Configuration, Guidance]\n\n**Output Format:** [Markdown with inline shell commands and JSON tool parameters]\n\n**Output Parameters:** [1D]\n\n**Other Properties Related to Output:** [May produce Grafana API tool-call guidance, connection checks, write previews, and troubleshooting steps.]\n\n## Skill Version(s):\n\n1.0.6 (source: ClawHub release evidence)\n\n## Ethical Considerations:\n\nUsers should evaluate whether this skill is appropriate for their environment, review any generated or modified files before relying on them, and apply their organization's safety, security, and compliance requirements before deployment.\n\nArchive v1.0.5: 3 files, 5658 bytes\n\nFiles: skill-card.md (2428b), SKILL.md (14238b), _meta.json (137b)\n\nFile v1.0.5:SKILL.md\n\n---\nname: grafana-monitoring\ndescription: Grafana HTTP API integration. Inspect dashboards, folders, data sources, alert rules, and teams. Use this skill when users want to query observability data, inspect monitoring resources, or manage Grafana dashboards.\n---\n\n# Grafana\n\n\n\nAccess Grafana via the Grafana HTTP API with managed credentials. Inspect dashboards, folders, data sources, alert rules, teams, and observability resources.\n\nThis skill uses [ClawLink](https://claw-link.dev) for hosted connection flows and credentials so you do not need to configure Grafana API access yourself.\n\n### Setup in 3 Steps\n\n| Step 1: Install | Step 2: Pair Account | Step 3: Connect Grafana |\n|:---:|:---:|:---:|\n|  |  | *App-specific connection GIF coming soon* |\n| Run the install command in OpenClaw | Sign in and approve the device | Open the dashboard and connect Grafana |\n\n## How It Works\n\n```\n┌─────────────────┐ ┌──────────────┐ ┌──────────────────┐\n│ OpenClaw │────▶│ ClawLink │────▶│ Grafana │\n│ (User Chat) │ │ (OAuth) │ │ (HTTP API) │\n└─────────────────┘ └──────────────┘ └──────────────────┘\n │ │ │\n │ 1. Install Plugin │ │\n │ 2. Pair Device │ │\n │ 3. Connect Grafana │ │\n │ │ 4. Secure Token │\n │ │ 5. Proxy Requests │\n │ │ │\n ▼ ▼ ▼\n ┌──────────┐ ┌──────────┐ ┌──────────┐\n │ SKILL │ │ Dashboard│ │ Grafana │\n │ File │ │ Auth │ │ Cloud │\n └──────────┘ └──────────┘ └──────────┘\n```\n\n## Install\n\nInstall the verified ClawLink plugin from ClawHub. After the user confirms, complete the full setup so ClawLink tools are visible in the next OpenClaw chat.\n\n```bash\nopenclaw plugins install clawhub:clawlink-plugin\nopenclaw config set tools.alsoAllow '[\"clawlink-plugin\"]' --strict-json\nopenclaw gateway restart\n```\n\nThen tell the user: \"OpenClaw has been restarted. Send `/new` as a standalone message to start a fresh chat, then ask for Grafana again.\"\n\n## Quick Start\n\n```bash\n# List dashboards\nclawlink_call_tool --tool \"grafana_list_dashboards\" --params '{}'\n\n# Get a dashboard\nclawlink_call_tool --tool \"grafana_get_dashboard\" --params '{\"uid\": \"YOUR_DASHBOARD_UID\"}'\n\n# List folders\nclawlink_call_tool --tool \"grafana_list_folders\" --params '{}'\n```\n\n## Authentication\n\nAll Grafana tool calls are authenticated automatically by ClawLink using the configured Grafana credentials (API key or service account token).\n\n**No API key is required in chat.** ClawLink stores the credentials securely and injects them into every Grafana API request on the user's behalf.\n\n### Getting Connected\n\n1. Install the ClawLink plugin (see Install above).\n2. Pair the plugin with `clawlink_begin_pairing` if it is not configured yet.\n3. Open https://claw-link.dev/dashboard?add=grafana and connect Grafana.\n4. Call `clawlink_list_integrations` to verify the connection is active.\n\n## Connection Management\n\n### List Connections\n\n```bash\nclawlink_list_integrations\n```\n\n**Response:** Returns all connected integrations. Look for `grafana` in the list.\n\n### Verify Connection\n\n```bash\nclawlink_list_tools --integration grafana\n```\n\n**Response:** Returns the live tool catalog for Grafana.\n\n### Reconnect\n\nIf Grafana tools are missing or the connection shows an error:\n\n1. Direct the user to https://claw-link.dev/dashboard?add=grafana\n2. After they confirm, call `clawlink_list_integrations` to verify\n3. Then call `clawlink_list_tools --integration grafana`\n\n## Security & Permissions\n\n- Access is scoped to resources the configured Grafana API key or service account can access.\n- **All write operations require explicit user confirmation.** Before executing any create, update, or delete call, confirm the target resource and intended effect with the user.\n- Destructive actions (delete dashboard, delete folder, delete alert rule) are marked as high-impact and must be confirmed.\n\n## Tool Reference\n\n### Dashboard Operations\n\n| Tool | Description | Mode |\n|------|-------------|------|\n| `grafana_list_dashboards` | List all dashboards the user can access | Read |\n| `grafana_get_dashboard` | Get a dashboard by UID | Read |\n| `grafana_create_dashboard` | Create a new dashboard | Write |\n| `grafana_update_dashboard` | Update an existing dashboard | Write |\n| `grafana_delete_dashboard` | Delete a dashboard | Write |\n| `grafana_get_dashboard_permissions` | Get permissions for a dashboard | Read |\n| `grafana_update_dashboard_permissions` | Update dashboard permissions | Write |\n\n### Folder Management\n\n| Tool | Description | Mode |\n|------|-------------|------|\n| `grafana_list_folders` | List all folders | Read |\n| `grafana_get_folder` | Get a folder by UID | Read |\n| `grafana_create_folder` | Create a new folder | Write |\n| `grafana_update_folder` | Update a folder's title or UID | Write |\n| `grafana_delete_folder` | Delete a folder | Write |\n\n### Data Sources\n\n| Tool | Description | Mode |\n|------|-------------|------|\n| `grafana_list_datasources` | List all configured data sources | Read |\n| `grafana_get_datasource` | Get a data source by ID | Read |\n| `grafana_create_datasource` | Create a new data source | Write |\n| `grafana_update_datasource` | Update a data source | Write |\n| `grafana_delete_datasource` | Delete a data source | Write |\n\n### Alert Rules\n\n| Tool | Description | Mode |\n|------|-------------|------|\n| `grafana_list_alert_rules` | List all alert rules | Read |\n| `grafana_get_alert_rule` | Get a specific alert rule by UID | Read |\n| `grafana_create_alert_rule` | Create a new alert rule | Write |\n| `grafana_update_alert_rule` | Update an existing alert rule | Write |\n| `grafana_delete_alert_rule` | Delete an alert rule | Write |\n\n### Alert Instances\n\n| Tool | Description | Mode |\n|------|-------------|------|\n| `grafana_list_alert_instances` | List active alert instances | Read |\n\n### Teams\n\n| Tool | Description | Mode |\n|------|-------------|------|\n| `grafana_list_teams` | List all teams | Read |\n| `grafana_get_team` | Get a team by ID | Read |\n| `grafana_create_team` | Create a new team | Write |\n| `grafana_update_team` | Update a team | Write |\n| `grafana_delete_team` | Delete a team | Write |\n| `grafana_list_team_members` | List members of a team | Read |\n| `grafana_add_team_member` | Add a member to a team | Write |\n| `grafana_remove_team_member` | Remove a member from a team | Write |\n\n### Admin & Organization\n\n| Tool | Description | Mode |\n|------|-------------|------|\n| `grafana_get_organization` | Get current organization info | Read |\n| `grafana_list_organization_users` | List users in the current organization | Read |\n| `grafana_list_users` | List all users in Grafana | Read |\n| `grafana_get_user` | Get a user by ID | Read |\n\n## Code Examples\n\n### List dashboards\n\n```bash\nclawlink_call_tool --tool \"grafana_list_dashboards\" \\\n --params '{\n \"limit\": 50\n }'\n```\n\n### Get a dashboard\n\n```bash\nclawlink_call_tool --tool \"grafana_get_dashboard\" \\\n --params '{\n \"uid\": \"YOUR_DASHBOARD_UID\"\n }'\n```\n\n### Create a new dashboard\n\n```bash\nclawlink_call_tool --tool \"grafana_create_dashboard\" \\\n --params '{\n \"dashboard\": {\n \"title\": \"Service Health Overview\",\n \"tags\": [\"health\", \"overview\"],\n \"timezone\": \"browser\",\n \"panels\": []\n },\n \"folderUid\": \"YOUR_FOLDER_UID\"\n }'\n```\n\n### List folders\n\n```bash\nclawlink_call_tool --tool \"grafana_list_folders\" \\\n --params '{}'\n```\n\n### List data sources\n\n```bash\nclawlink_call_tool --tool \"grafana_list_datasources\" \\\n --params '{}'\n```\n\n### Create an alert rule\n\n```bash\nclawlink_call_tool --tool \"grafana_create_alert_rule\" \\\n --params '{\n \"title\": \"High Error Rate\",\n \"condition\": \"C\",\n \"data\": [\n {\"refId\": \"A\", \"queryType\": \"prometheus\"},\n {\"refId\": \"B\", \"queryType\": \"reduce\"},\n {\"refId\": \"C\", \"queryType\": \"threshold\"}\n ],\n \"folderUID\": \"YOUR_FOLDER_UID\"\n }'\n```\n\n## Discovery Workflow\n\n1. Call `clawlink_list_integrations` to confirm Grafana is connected.\n2. Call `clawlink_list_tools --integration grafana` to see the live catalog.\n3. Treat the returned list as the source of truth. Do not guess or assume what tools exist.\n4. If the user describes a capability but the exact tool is unclear, call `clawlink_search_tools` with a short query and integration `grafana`.\n5. If no Grafana tools appear, direct the user to https://claw-link.dev/dashboard?add=grafana.\n\n## Execution Workflow\n\n```\n┌─────────────────────────────────────────────────────────────┐\n│ READ OPERATIONS (Safe) │\n│ list → get → call │\n│ │\n│ Example: List dashboards → Get details → Show results │\n└─────────────────────────────────────────────────────────────┘\n │\n ▼\n┌─────────────────────────────────────────────────────────────┐\n│ WRITE OPERATIONS (Require Confirmation) │\n│ describe → preview → confirm → call │\n│ │\n│ Example: Describe tool → Preview → User approves │\n│ → Execute update │\n└─────────────────────────────────────────────────────────────┘\n```\n\n1. For unfamiliar tools, ambiguous requests, or any write action, call `clawlink_describe_tool` first.\n2. Use the returned guidance, schema, `whenToUse`, `askBefore`, `safeDefaults`, `examples`, and `followups` to shape the call.\n3. Prefer read, list, and get operations before writes.\n4. For writes or anything marked as requiring confirmation, call `clawlink_preview_tool` first.\n5. Execute with `clawlink_call_tool`. Pass confirmation only after the preview matches the user's intent.\n6. If the tool call fails, report the real error. Do not invent results or restate the failure as a missing capability unless the live catalog supports that conclusion.\n\n## Notes\n\n- Grafana supports both Grafana Cloud and self-hosted (OSS/Enterprise) instances.\n- API access requires an API key or service account token with appropriate roles.\n- Dashboard UIDs are the stable identifier for sharing and API calls.\n- Folder UIDs are used to organize dashboards and alert rules.\n- Alert rules must be placed in a folder and reference a data source.\n- Permissions for dashboards and folders can be configured to control access.\n\n## Error Handling\n\n| Status / Error | Meaning |\n|----------------|---------|\n| Tool not found | The tool name does not exist in the current catalog. Verify with `clawlink_list_tools --integration grafana`. |\n| Missing connection | Grafana is not connected. Direct the user to https://claw-link.dev/dashboard?add=grafana. |\n| `DASHBOARD_NOT_FOUND` | Dashboard does not exist. Check the UID. |\n| `INVALID_ARGUMENT` | Invalid parameter or missing required field. Review the tool schema with `clawlink_describe_tool`. |\n| `UNAUTHORIZED` | Grafana credentials are invalid or lack permissions. Check API key access. |\n| Write rejected | User did not confirm a write action. Always confirm before executing writes. |\n\n### Troubleshooting: Tools Not Visible\n\n1. Check that the ClawLink plugin is installed:\n ```bash\n openclaw plugins list\n ```\n2. If the plugin is installed but tools are missing, tell the user to send `/new` as a standalone message to reload the catalog.\n3. If a fresh chat does not help, run:\n ```bash\n openclaw config set tools.alsoAllow '[\"clawlink-plugin\"]' --strict-json\n openclaw gateway restart\n ```\n4. After restart, tell the user to send `/new` again and retry.\n\n### Troubleshooting: Invalid Tool Call\n\n1. Ensure the integration slug is exactly `grafana`.\n2. Use `clawlink_describe_tool` to verify parameter names and types before calling.\n3. For write operations, always call `clawlink_preview_tool` first.\n\n## Resources\n\n- [Grafana HTTP API Documentation](https://grafana.com/docs/grafana/latest/developers/http_api/)\n- [Dashboard API](https://grafana.com/docs/grafana/latest/developers/http_api/dashboard/)\n- [Alerting API](https://grafana.com/docs/grafana/latest/developers/http_api/alerting/)\n- ClawLink: https://claw-link.dev\n- ClawLink Docs: https://docs.claw-link.dev/openclaw\n- ClawLink Verification: https://claw-link.dev/verify\n\n---\n\n**Powered by [ClawLink](https://claw-link.dev)** — an integration hub for OpenClaw\n\n\n\nFile v1.0.5:_meta.json\n\n{\n \"ownerId\": \"kn713pxvayh8fjhb503zjb8yxh815j54\",\n \"slug\": \"grafana-monitoring\",\n \"version\": \"1.0.5\",\n \"publishedAt\": 1780985396240\n}\n\nFile v1.0.5:skill-card.md\n\n## Description:
\nGrafana HTTP API integration. Inspect dashboards, folders, data sources, alert rules, and teams. Use this skill when users want to query observability data, inspect monitoring resources, or manage Grafana dashboards.
\n\nThis skill is ready for commercial/non-commercial use.
\n\n## Publisher:
\n[hith3sh](https://clawhub.ai/user/hith3sh)
\n\n### License/Terms of Use:
\nMIT-0
\n\n\n## Use Case:
\nDevelopers, SREs, and operations teams use this skill to inspect and manage Grafana observability resources through authenticated Grafana HTTP API tools.
\n\n### Deployment Geography for Use:
\nGlobal
\n\n## Known Risks and Mitigations:
\nRisk: Grafana API keys or service account tokens can expose resources available to the configured credential.
\nMitigation: Trust ClawLink before connecting credentials and use the least-privileged Grafana token that supports the intended tasks.
\nRisk: Create, update, and delete operations can modify dashboards, folders, data sources, alert rules, teams, or permissions.
\nMitigation: Review previews carefully and require explicit approval before any write or destructive operation.
\n\n\n## Reference(s):
\n- [Grafana HTTP API Documentation](https://grafana.com/docs/grafana/latest/developers/http_api/)
\n- [Grafana Dashboard API](https://grafana.com/docs/grafana/latest/developers/http_api/dashboard/)
\n- [Grafana Alerting API](https://grafana.com/docs/grafana/latest/developers/http_api/alerting/)
\n- [ClawLink OpenClaw Documentation](https://docs.claw-link.dev/openclaw)
\n- [ClawHub Skill Page](https://clawhub.ai/hith3sh/grafana-monitoring)
\n- [Publisher Profile](https://clawhub.ai/user/hith3sh)
\n\n\n## Skill Output:
\n**Output Type(s):** [guidance, shell commands, configuration, API calls]
\n**Output Format:** [Markdown with inline shell commands and JSON tool parameters]
\n**Output Parameters:** [1D]
\n**Other Properties Related to Output:** [Uses live Grafana tool schemas and preview-confirmation flow for write operations.]
\n\n## Skill Version(s):
\n1.0.5 (source: server release evidence)
\n\n## Ethical Considerations:
\nUsers should evaluate whether this skill is appropriate for their environment, review any generated or modified files before relying on them, and apply their organization's safety, security, and compliance requirements before deployment.
\n\nArchive v1.0.4: 3 files, 5505 bytes\n\nFiles: skill-card.md (2073b), SKILL.md (14234b), _meta.json (137b)\n\nFile v1.0.4:SKILL.md\n\n---\nname: grafana-monitoring\ndescription: Grafana HTTP API integration. Inspect dashboards, folders, data sources, alert rules, and teams. Use this skill when users want to query observability data, inspect monitoring resources, or manage Grafana dashboards.\n---\n\n# Grafana\n\n\n\nAccess Grafana via the Grafana HTTP API with managed credentials. Inspect dashboards, folders, data sources, alert rules, teams, and observability resources.\n\nThis skill uses [ClawLink](https://claw-link.dev) for hosted connection flows and credentials so you do not need to configure Grafana API access yourself.\n\n### Setup in 3 Steps\n\n| Step 1: Install | Step 2: Pair Account | Step 3: Connect Grafana |\n|:---:|:---:|:---:|\n|  |  | *App-specific connection GIF coming soon* |\n| Run the install command in OpenClaw | Sign in and approve the device | Open the dashboard and connect Grafana |\n\n## How It Works\n\n```\n┌─────────────────┐ ┌──────────────┐ ┌──────────────────┐\n│ OpenClaw │────▶│ ClawLink │────▶│ Grafana │\n│ (User Chat) │ │ (OAuth) │ │ (HTTP API) │\n└─────────────────┘ └──────────────┘ └──────────────────┘\n │ │ │\n │ 1. Install Plugin │ │\n │ 2. Pair Device │ │\n │ 3. Connect Grafana │ │\n │ │ 4. Secure Token │\n │ │ 5. Proxy Requests │\n │ │ │\n ▼ ▼ ▼\n ┌──────────┐ ┌──────────┐ ┌──────────┐\n │ SKILL │ │ Dashboard│ │ Grafana │\n │ File │ │ Auth │ │ Cloud │\n └──────────┘ └──────────┘ └──────────┘\n```\n\n## Install\n\nInstall the verified ClawLink plugin from ClawHub. After the user confirms, complete the full setup so ClawLink tools are visible in the next OpenClaw chat.\n\n```bash\nopenclaw plugins install clawhub:clawlink-plugin\nopenclaw config set tools.alsoAllow '[\"clawlink-plugin\"]' --strict-json\nopenclaw gateway restart\n```\n\nThen tell the user: \"OpenClaw has been restarted. Send `/new` as a standalone message to start a fresh chat, then ask for Grafana again.\"\n\n## Quick Start\n\n```bash\n# List dashboards\nclawlink_call_tool --tool \"grafana_list_dashboards\" --params '{}'\n\n# Get a dashboard\nclawlink_call_tool --tool \"grafana_get_dashboard\" --params '{\"uid\": \"YOUR_DASHBOARD_UID\"}'\n\n# List folders\nclawlink_call_tool --tool \"grafana_list_folders\" --params '{}'\n```\n\n## Authentication\n\nAll Grafana tool calls are authenticated automatically by ClawLink using the configured Grafana credentials (API key or service account token).\n\n**No API key is required in chat.** ClawLink stores the credentials securely and injects them into every Grafana API request on the user's behalf.\n\n### Getting Connected\n\n1. Install the ClawLink plugin (see Install above).\n2. Pair the plugin with `clawlink_begin_pairing` if it is not configured yet.\n3. Open https://claw-link.dev/dashboard?add=grafana and connect Grafana.\n4. Call `clawlink_list_integrations` to verify the connection is active.\n\n## Connection Management\n\n### List Connections\n\n```bash\nclawlink_list_integrations\n```\n\n**Response:** Returns all connected integrations. Look for `grafana` in the list.\n\n### Verify Connection\n\n```bash\nclawlink_list_tools --integration grafana\n```\n\n**Response:** Returns the live tool catalog for Grafana.\n\n### Reconnect\n\nIf Grafana tools are missing or the connection shows an error:\n\n1. Direct the user to https://claw-link.dev/dashboard?add=grafana\n2. After they confirm, call `clawlink_list_integrations` to verify\n3. Then call `clawlink_list_tools --integration grafana`\n\n## Security & Permissions\n\n- Access is scoped to resources the configured Grafana API key or service account can access.\n- **All write operations require explicit user confirmation.** Before executing any create, update, or delete call, confirm the target resource and intended effect with the user.\n- Destructive actions (delete dashboard, delete folder, delete alert rule) are marked as high-impact and must be confirmed.\n\n## Tool Reference\n\n### Dashboard Operations\n\n| Tool | Description | Mode |\n|------|-------------|------|\n| `grafana_list_dashboards` | List all dashboards the user can access | Read |\n| `grafana_get_dashboard` | Get a dashboard by UID | Read |\n| `grafana_create_dashboard` | Create a new dashboard | Write |\n| `grafana_update_dashboard` | Update an existing dashboard | Write |\n| `grafana_delete_dashboard` | Delete a dashboard | Write |\n| `grafana_get_dashboard_permissions` | Get permissions for a dashboard | Read |\n| `grafana_update_dashboard_permissions` | Update dashboard permissions | Write |\n\n### Folder Management\n\n| Tool | Description | Mode |\n|------|-------------|------|\n| `grafana_list_folders` | List all folders | Read |\n| `grafana_get_folder` | Get a folder by UID | Read |\n| `grafana_create_folder` | Create a new folder | Write |\n| `grafana_update_folder` | Update a folder's title or UID | Write |\n| `grafana_delete_folder` | Delete a folder | Write |\n\n### Data Sources\n\n| Tool | Description | Mode |\n|------|-------------|------|\n| `grafana_list_datasources` | List all configured data sources | Read |\n| `grafana_get_datasource` | Get a data source by ID | Read |\n| `grafana_create_datasource` | Create a new data source | Write |\n| `grafana_update_datasource` | Update a data source | Write |\n| `grafana_delete_datasource` | Delete a data source | Write |\n\n### Alert Rules\n\n| Tool | Description | Mode |\n|------|-------------|------|\n| `grafana_list_alert_rules` | List all alert rules | Read |\n| `grafana_get_alert_rule` | Get a specific alert rule by UID | Read |\n| `grafana_create_alert_rule` | Create a new alert rule | Write |\n| `grafana_update_alert_rule` | Update an existing alert rule | Write |\n| `grafana_delete_alert_rule` | Delete an alert rule | Write |\n\n### Alert Instances\n\n| Tool | Description | Mode |\n|------|-------------|------|\n| `grafana_list_alert_instances` | List active alert instances | Read |\n\n### Teams\n\n| Tool | Description | Mode |\n|------|-------------|------|\n| `grafana_list_teams` | List all teams | Read |\n| `grafana_get_team` | Get a team by ID | Read |\n| `grafana_create_team` | Create a new team | Write |\n| `grafana_update_team` | Update a team | Write |\n| `grafana_delete_team` | Delete a team | Write |\n| `grafana_list_team_members` | List members of a team | Read |\n| `grafana_add_team_member` | Add a member to a team | Write |\n| `grafana_remove_team_member` | Remove a member from a team | Write |\n\n### Admin & Organization\n\n| Tool | Description | Mode |\n|------|-------------|------|\n| `grafana_get_organization` | Get current organization info | Read |\n| `grafana_list_organization_users` | List users in the current organization | Read |\n| `grafana_list_users` | List all users in Grafana | Read |\n| `grafana_get_user` | Get a user by ID | Read |\n\n## Code Examples\n\n### List dashboards\n\n```bash\nclawlink_call_tool --tool \"grafana_list_dashboards\" \\\n --params '{\n \"limit\": 50\n }'\n```\n\n### Get a dashboard\n\n```bash\nclawlink_call_tool --tool \"grafana_get_dashboard\" \\\n --params '{\n \"uid\": \"YOUR_DASHBOARD_UID\"\n }'\n```\n\n### Create a new dashboard\n\n```bash\nclawlink_call_tool --tool \"grafana_create_dashboard\" \\\n --params '{\n \"dashboard\": {\n \"title\": \"Service Health Overview\",\n \"tags\": [\"health\", \"overview\"],\n \"timezone\": \"browser\",\n \"panels\": []\n },\n \"folderUid\": \"YOUR_FOLDER_UID\"\n }'\n```\n\n### List folders\n\n```bash\nclawlink_call_tool --tool \"grafana_list_folders\" \\\n --params '{}'\n```\n\n### List data sources\n\n```bash\nclawlink_call_tool --tool \"grafana_list_datasources\" \\\n --params '{}'\n```\n\n### Create an alert rule\n\n```bash\nclawlink_call_tool --tool \"grafana_create_alert_rule\" \\\n --params '{\n \"title\": \"High Error Rate\",\n \"condition\": \"C\",\n \"data\": [\n {\"refId\": \"A\", \"queryType\": \"prometheus\"},\n {\"refId\": \"B\", \"queryType\": \"reduce\"},\n {\"refId\": \"C\", \"queryType\": \"threshold\"}\n ],\n \"folderUID\": \"YOUR_FOLDER_UID\"\n }'\n```\n\n## Discovery Workflow\n\n1. Call `clawlink_list_integrations` to confirm Grafana is connected.\n2. Call `clawlink_list_tools --integration grafana` to see the live catalog.\n3. Treat the returned list as the source of truth. Do not guess or assume what tools exist.\n4. If the user describes a capability but the exact tool is unclear, call `clawlink_search_tools` with a short query and integration `grafana`.\n5. If no Grafana tools appear, direct the user to https://claw-link.dev/dashboard?add=grafana.\n\n## Execution Workflow\n\n```\n┌─────────────────────────────────────────────────────────────┐\n│ READ OPERATIONS (Safe) │\n│ list → get → call │\n│ │\n│ Example: List dashboards → Get details → Show results │\n└─────────────────────────────────────────────────────────────┘\n │\n ▼\n┌─────────────────────────────────────────────────────────────┐\n│ WRITE OPERATIONS (Require Confirmation) │\n│ describe → preview → confirm → call │\n│ │\n│ Example: Describe tool → Preview → User approves │\n│ → Execute update │\n└─────────────────────────────────────────────────────────────┘\n```\n\n1. For unfamiliar tools, ambiguous requests, or any write action, call `clawlink_describe_tool` first.\n2. Use the returned guidance, schema, `whenToUse`, `askBefore`, `safeDefaults`, `examples`, and `followups` to shape the call.\n3. Prefer read, list, and get operations before writes.\n4. For writes or anything marked as requiring confirmation, call `clawlink_preview_tool` first.\n5. Execute with `clawlink_call_tool`. Pass confirmation only after the preview matches the user's intent.\n6. If the tool call fails, report the real error. Do not invent results or restate the failure as a missing capability unless the live catalog supports that conclusion.\n\n## Notes\n\n- Grafana supports both Grafana Cloud and self-hosted (OSS/Enterprise) instances.\n- API access requires an API key or service account token with appropriate roles.\n- Dashboard UIDs are the stable identifier for sharing and API calls.\n- Folder UIDs are used to organize dashboards and alert rules.\n- Alert rules must be placed in a folder and reference a data source.\n- Permissions for dashboards and folders can be configured to control access.\n\n## Error Handling\n\n| Status / Error | Meaning |\n|----------------|---------|\n| Tool not found | The tool name does not exist in the current catalog. Verify with `clawlink_list_tools --integration grafana`. |\n| Missing connection | Grafana is not connected. Direct the user to https://claw-link.dev/dashboard?add=grafana. |\n| `DASHBOARD_NOT_FOUND` | Dashboard does not exist. Check the UID. |\n| `INVALID_ARGUMENT` | Invalid parameter or missing required field. Review the tool schema with `clawlink_describe_tool`. |\n| `UNAUTHORIZED` | Grafana credentials are invalid or lack permissions. Check API key access. |\n| Write rejected | User did not confirm a write action. Always confirm before executing writes. |\n\n### Troubleshooting: Tools Not Visible\n\n1. Check that the ClawLink plugin is installed:\n ```bash\n openclaw plugins list\n ```\n2. If the plugin is installed but tools are missing, tell the user to send `/new` as a standalone message to reload the catalog.\n3. If a fresh chat does not help, run:\n ```bash\n openclaw config set tools.alsoAllow '[\"clawlink-plugin\"]' --strict-json\n openclaw gateway restart\n ```\n4. After restart, tell the user to send `/new` again and retry.\n\n### Troubleshooting: Invalid Tool Call\n\n1. Ensure the integration slug is exactly `grafana`.\n2. Use `clawlink_describe_tool` to verify parameter names and types before calling.\n3. For write operations, always call `clawlink_preview_tool` first.\n\n## Resources\n\n- [Grafana HTTP API Documentation](https://grafana.com/docs/grafana/latest/developers/http_api/)\n- [Dashboard API](https://grafana.com/docs/grafana/latest/developers/http_api/dashboard/)\n- [Alerting API](https://grafana.com/docs/grafana/latest/developers/http_api/alerting/)\n- ClawLink: https://claw-link.dev\n- ClawLink Docs: https://docs.claw-link.dev/openclaw\n- ClawLink Verification: https://claw-link.dev/verify\n\n---\n\n**Powered by [ClawLink](https://claw-link.dev)** — an integration hub for OpenClaw\n\n\n\nFile v1.0.4:_meta.json\n\n{\n \"ownerId\": \"kn713pxvayh8fjhb503zjb8yxh815j54\",\n \"slug\": \"grafana-monitoring\",\n \"version\": \"1.0.4\",\n \"publishedAt\": 1780981005256\n}\n\nFile v1.0.4:skill-card.md\n\n## Description:
\nGrafana HTTP API integration for inspecting and managing dashboards, folders, data sources, alert rules, teams, and observability resources.
\n\nThis skill is ready for commercial/non-commercial use.
\n\n## Publisher:
\n[hith3sh](https://clawhub.ai/user/hith3sh)
\n\n### License/Terms of Use:
\nMIT-0
\n\n\n## Use Case:
\nDevelopers, SREs, and operators use this skill to query Grafana monitoring data and manage dashboards, folders, data sources, alerting resources, teams, and organization information through managed ClawLink credentials.
\n\n### Deployment Geography for Use:
\nGlobal
\n\n## Known Risks and Mitigations:
\nRisk: Review before execution as proposals could introduce incorrect or misleading guidance into skills.
\nMitigation: Review and scan skill before deployment.
\n\n## Reference(s):
\n- [Grafana HTTP API Documentation](https://grafana.com/docs/grafana/latest/developers/http_api/)
\n- [Grafana Dashboard API](https://grafana.com/docs/grafana/latest/developers/http_api/dashboard/)
\n- [Grafana Alerting API](https://grafana.com/docs/grafana/latest/developers/http_api/alerting/)
\n- [ClawLink OpenClaw Documentation](https://docs.claw-link.dev/openclaw)
\n- [ClawLink Dashboard](https://claw-link.dev/dashboard?add=grafana)
\n\n\n## Skill Output:
\n**Output Type(s):** [Text, Markdown, Shell commands, Configuration, Guidance]
\n**Output Format:** [Markdown with inline shell commands and JSON tool-call parameters]
\n**Output Parameters:** [1D]
\n**Other Properties Related to Output:** [May include Grafana API tool names, request parameters, preview guidance, and user-confirmation steps for write operations.]
\n\n## Skill Version(s):
\n1.0.4 (source: server release evidence)
\n\n## Ethical Considerations:
\nUsers should evaluate whether this skill is appropriate for their environment, review any generated or modified files before relying on them, and apply their organization's safety, security, and compliance requirements before deployment.
\n\nArchive v1.0.1: 3 files, 5734 bytes\n\nFiles: skill-card.md (2671b), SKILL.md (14234b), _meta.json (137b)\n\nFile v1.0.1:SKILL.md\n\n---\nname: grafana-monitoring\ndescription: Grafana HTTP API integration. Inspect dashboards, folders, data sources, alert rules, and teams. Use this skill when users want to query observability data, inspect monitoring resources, or manage Grafana dashboards.\n---\n\n# Grafana\n\n\n\nAccess Grafana via the Grafana HTTP API with managed credentials. Inspect dashboards, folders, data sources, alert rules, teams, and observability resources.\n\nThis skill uses [ClawLink](https://claw-link.dev) for hosted connection flows and credentials so you do not need to configure Grafana API access yourself.\n\n### Setup in 3 Steps\n\n| Step 1: Install | Step 2: Pair Account | Step 3: Connect Grafana |\n|:---:|:---:|:---:|\n|  |  | *App-specific connection GIF coming soon* |\n| Run the install command in OpenClaw | Sign in and approve the device | Open the dashboard and connect Grafana |\n\n## How It Works\n\n```\n┌─────────────────┐ ┌──────────────┐ ┌──────────────────┐\n│ OpenClaw │────▶│ ClawLink │────▶│ Grafana │\n│ (User Chat) │ │ (OAuth) │ │ (HTTP API) │\n└─────────────────┘ └──────────────┘ └──────────────────┘\n │ │ │\n │ 1. Install Plugin │ │\n │ 2. Pair Device │ │\n │ 3. Connect Grafana │ │\n │ │ 4. Secure Token │\n │ │ 5. Proxy Requests │\n │ │ │\n ▼ ▼ ▼\n ┌──────────┐ ┌──────────┐ ┌──────────┐\n │ SKILL │ │ Dashboard│ │ Grafana │\n │ File │ │ Auth │ │ Cloud │\n └──────────┘ └──────────┘ └──────────┘\n```\n\n## Install\n\nInstall the verified ClawLink plugin from ClawHub. After the user confirms, complete the full setup so ClawLink tools are visible in the next OpenClaw chat.\n\n```bash\nopenclaw plugins install clawhub:clawlink-plugin\nopenclaw config set tools.alsoAllow '[\"clawlink-plugin\"]' --strict-json\nopenclaw gateway restart\n```\n\nThen tell the user: \"OpenClaw has been restarted. Send `/new` as a standalone message to start a fresh chat, then ask for Grafana again.\"\n\n## Quick Start\n\n```bash\n# List dashboards\nclawlink_call_tool --tool \"grafana_list_dashboards\" --params '{}'\n\n# Get a dashboard\nclawlink_call_tool --tool \"grafana_get_dashboard\" --params '{\"uid\": \"YOUR_DASHBOARD_UID\"}'\n\n# List folders\nclawlink_call_tool --tool \"grafana_list_folders\" --params '{}'\n```\n\n## Authentication\n\nAll Grafana tool calls are authenticated automatically by ClawLink using the configured Grafana credentials (API key or service account token).\n\n**No API key is required in chat.** ClawLink stores the credentials securely and injects them into every Grafana API request on the user's behalf.\n\n### Getting Connected\n\n1. Install the ClawLink plugin (see Install above).\n2. Pair the plugin with `clawlink_begin_pairing` if it is not configured yet.\n3. Open https://claw-link.dev/dashboard?add=grafana and connect Grafana.\n4. Call `clawlink_list_integrations` to verify the connection is active.\n\n## Connection Management\n\n### List Connections\n\n```bash\nclawlink_list_integrations\n```\n\n**Response:** Returns all connected integrations. Look for `grafana` in the list.\n\n### Verify Connection\n\n```bash\nclawlink_list_tools --integration grafana\n```\n\n**Response:** Returns the live tool catalog for Grafana.\n\n### Reconnect\n\nIf Grafana tools are missing or the connection shows an error:\n\n1. Direct the user to https://claw-link.dev/dashboard?add=grafana\n2. After they confirm, call `clawlink_list_integrations` to verify\n3. Then call `clawlink_list_tools --integration grafana`\n\n## Security & Permissions\n\n- Access is scoped to resources the configured Grafana API key or service account can access.\n- **All write operations require explicit user confirmation.** Before executing any create, update, or delete call, confirm the target resource and intended effect with the user.\n- Destructive actions (delete dashboard, delete folder, delete alert rule) are marked as high-impact and must be confirmed.\n\n## Tool Reference\n\n### Dashboard Operations\n\n| Tool | Description | Mode |\n|------|-------------|------|\n| `grafana_list_dashboards` | List all dashboards the user can access | Read |\n| `grafana_get_dashboard` | Get a dashboard by UID | Read |\n| `grafana_create_dashboard` | Create a new dashboard | Write |\n| `grafana_update_dashboard` | Update an existing dashboard | Write |\n| `grafana_delete_dashboard` | Delete a dashboard | Write |\n| `grafana_get_dashboard_permissions` | Get permissions for a dashboard | Read |\n| `grafana_update_dashboard_permissions` | Update dashboard permissions | Write |\n\n### Folder Management\n\n| Tool | Description | Mode |\n|------|-------------|------|\n| `grafana_list_folders` | List all folders | Read |\n| `grafana_get_folder` | Get a folder by UID | Read |\n| `grafana_create_folder` | Create a new folder | Write |\n| `grafana_update_folder` | Update a folder's title or UID | Write |\n| `grafana_delete_folder` | Delete a folder | Write |\n\n### Data Sources\n\n| Tool | Description | Mode |\n|------|-------------|------|\n| `grafana_list_datasources` | List all configured data sources | Read |\n| `grafana_get_datasource` | Get a data source by ID | Read |\n| `grafana_create_datasource` | Create a new data source | Write |\n| `grafana_update_datasource` | Update a data source | Write |\n| `grafana_delete_datasource` | Delete a data source | Write |\n\n### Alert Rules\n\n| Tool | Description | Mode |\n|------|-------------|------|\n| `grafana_list_alert_rules` | List all alert rules | Read |\n| `grafana_get_alert_rule` | Get a specific alert rule by UID | Read |\n| `grafana_create_alert_rule` | Create a new alert rule | Write |\n| `grafana_update_alert_rule` | Update an existing alert rule | Write |\n| `grafana_delete_alert_rule` | Delete an alert rule | Write |\n\n### Alert Instances\n\n| Tool | Description | Mode |\n|------|-------------|------|\n| `grafana_list_alert_instances` | List active alert instances | Read |\n\n### Teams\n\n| Tool | Description | Mode |\n|------|-------------|------|\n| `grafana_list_teams` | List all teams | Read |\n| `grafana_get_team` | Get a team by ID | Read |\n| `grafana_create_team` | Create a new team | Write |\n| `grafana_update_team` | Update a team | Write |\n| `grafana_delete_team` | Delete a team | Write |\n| `grafana_list_team_members` | List members of a team | Read |\n| `grafana_add_team_member` | Add a member to a team | Write |\n| `grafana_remove_team_member` | Remove a member from a team | Write |\n\n### Admin & Organization\n\n| Tool | Description | Mode |\n|------|-------------|------|\n| `grafana_get_organization` | Get current organization info | Read |\n| `grafana_list_organization_users` | List users in the current organization | Read |\n| `grafana_list_users` | List all users in Grafana | Read |\n| `grafana_get_user` | Get a user by ID | Read |\n\n## Code Examples\n\n### List dashboards\n\n```bash\nclawlink_call_tool --tool \"grafana_list_dashboards\" \\\n --params '{\n \"limit\": 50\n }'\n```\n\n### Get a dashboard\n\n```bash\nclawlink_call_tool --tool \"grafana_get_dashboard\" \\\n --params '{\n \"uid\": \"YOUR_DASHBOARD_UID\"\n }'\n```\n\n### Create a new dashboard\n\n```bash\nclawlink_call_tool --tool \"grafana_create_dashboard\" \\\n --params '{\n \"dashboard\": {\n \"title\": \"Service Health Overview\",\n \"tags\": [\"health\", \"overview\"],\n \"timezone\": \"browser\",\n \"panels\": []\n },\n \"folderUid\": \"YOUR_FOLDER_UID\"\n }'\n```\n\n### List folders\n\n```bash\nclawlink_call_tool --tool \"grafana_list_folders\" \\\n --params '{}'\n```\n\n### List data sources\n\n```bash\nclawlink_call_tool --tool \"grafana_list_datasources\" \\\n --params '{}'\n```\n\n### Create an alert rule\n\n```bash\nclawlink_call_tool --tool \"grafana_create_alert_rule\" \\\n --params '{\n \"title\": \"High Error Rate\",\n \"condition\": \"C\",\n \"data\": [\n {\"refId\": \"A\", \"queryType\": \"prometheus\"},\n {\"refId\": \"B\", \"queryType\": \"reduce\"},\n {\"refId\": \"C\", \"queryType\": \"threshold\"}\n ],\n \"folderUID\": \"YOUR_FOLDER_UID\"\n }'\n```\n\n## Discovery Workflow\n\n1. Call `clawlink_list_integrations` to confirm Grafana is connected.\n2. Call `clawlink_list_tools --integration grafana` to see the live catalog.\n3. Treat the returned list as the source of truth. Do not guess or assume what tools exist.\n4. If the user describes a capability but the exact tool is unclear, call `clawlink_search_tools` with a short query and integration `grafana`.\n5. If no Grafana tools appear, direct the user to https://claw-link.dev/dashboard?add=grafana.\n\n## Execution Workflow\n\n```\n┌─────────────────────────────────────────────────────────────┐\n│ READ OPERATIONS (Safe) │\n│ list → get → call │\n│ │\n│ Example: List dashboards → Get details → Show results │\n└─────────────────────────────────────────────────────────────┘\n │\n ▼\n┌─────────────────────────────────────────────────────────────┐\n│ WRITE OPERATIONS (Require Confirmation) │\n│ describe → preview → confirm → call │\n│ │\n│ Example: Describe tool → Preview → User approves │\n│ → Execute update │\n└─────────────────────────────────────────────────────────────┘\n```\n\n1. For unfamiliar tools, ambiguous requests, or any write action, call `clawlink_describe_tool` first.\n2. Use the returned guidance, schema, `whenToUse`, `askBefore`, `safeDefaults`, `examples`, and `followups` to shape the call.\n3. Prefer read, list, and get operations before writes.\n4. For writes or anything marked as requiring confirmation, call `clawlink_preview_tool` first.\n5. Execute with `clawlink_call_tool`. Pass confirmation only after the preview matches the user's intent.\n6. If the tool call fails, report the real error. Do not invent results or restate the failure as a missing capability unless the live catalog supports that conclusion.\n\n## Notes\n\n- Grafana supports both Grafana Cloud and self-hosted (OSS/Enterprise) instances.\n- API access requires an API key or service account token with appropriate roles.\n- Dashboard UIDs are the stable identifier for sharing and API calls.\n- Folder UIDs are used to organize dashboards and alert rules.\n- Alert rules must be placed in a folder and reference a data source.\n- Permissions for dashboards and folders can be configured to control access.\n\n## Error Handling\n\n| Status / Error | Meaning |\n|----------------|---------|\n| Tool not found | The tool name does not exist in the current catalog. Verify with `clawlink_list_tools --integration grafana`. |\n| Missing connection | Grafana is not connected. Direct the user to https://claw-link.dev/dashboard?add=grafana. |\n| `DASHBOARD_NOT_FOUND` | Dashboard does not exist. Check the UID. |\n| `INVALID_ARGUMENT` | Invalid parameter or missing required field. Review the tool schema with `clawlink_describe_tool`. |\n| `UNAUTHORIZED` | Grafana credentials are invalid or lack permissions. Check API key access. |\n| Write rejected | User did not confirm a write action. Always confirm before executing writes. |\n\n### Troubleshooting: Tools Not Visible\n\n1. Check that the ClawLink plugin is installed:\n ```bash\n openclaw plugins list\n ```\n2. If the plugin is installed but tools are missing, tell the user to send `/new` as a standalone message to reload the catalog.\n3. If a fresh chat does not help, run:\n ```bash\n openclaw config set tools.alsoAllow '[\"clawlink-plugin\"]' --strict-json\n openclaw gateway restart\n ```\n4. After restart, tell the user to send `/new` again and retry.\n\n### Troubleshooting: Invalid Tool Call\n\n1. Ensure the integration slug is exactly `grafana`.\n2. Use `clawlink_describe_tool` to verify parameter names and types before calling.\n3. For write operations, always call `clawlink_preview_tool` first.\n\n## Resources\n\n- [Grafana HTTP API Documentation](https://grafana.com/docs/grafana/latest/developers/http_api/)\n- [Dashboard API](https://grafana.com/docs/grafana/latest/developers/http_api/dashboard/)\n- [Alerting API](https://grafana.com/docs/grafana/latest/developers/http_api/alerting/)\n- ClawLink: https://claw-link.dev\n- ClawLink Docs: https://docs.claw-link.dev/openclaw\n- ClawLink Verification: https://claw-link.dev/verify\n\n---\n\n**Powered by [ClawLink](https://claw-link.dev)** — an integration hub for OpenClaw\n\n\n\nFile v1.0.1:_meta.json\n\n{\n \"ownerId\": \"kn713pxvayh8fjhb503zjb8yxh815j54\",\n \"slug\": \"grafana-monitoring\",\n \"version\": \"1.0.1\",\n \"publishedAt\": 1780936692012\n}\n\nFile v1.0.1:skill-card.md\n\n## Description:
\nGrafana HTTP API integration. Inspect dashboards, folders, data sources, alert rules, and teams. Use this skill when users want to query observability data, inspect monitoring resources, or manage Grafana dashboards.
\n\nThis skill is ready for commercial/non-commercial use.
\n\n## Publisher:
\n[hith3sh](https://clawhub.ai/user/hith3sh)
\n\n### License/Terms of Use:
\nMIT-0
\n\n\n## Use Case:
\nDevelopers, SREs, and observability teams use this skill to inspect Grafana dashboards, folders, data sources, alerting resources, users, and teams through ClawLink-managed Grafana API access.
\n\n### Deployment Geography for Use:
\nGlobal
\n\n## Known Risks and Mitigations:
\nRisk: The skill requires OAuth or sensitive credentials through connected Grafana access.
\nMitigation: Install only from a trusted publisher and review OAuth, plugin, and Grafana service account permissions during setup.
\nRisk: Grafana write operations can create, update, or delete dashboards, folders, data sources, alert rules, teams, or users.
\nMitigation: Confirm the target resource and intended effect before any write or destructive operation, and use the preview workflow when available.
\nRisk: Over-privileged Grafana credentials can expose more dashboards, alerting resources, or administrative data than needed.
\nMitigation: Use the least-privileged Grafana API key or service account token that supports the intended workflow.
\n\n\n## Reference(s):
\n- [ClawHub Grafana Skill](https://clawhub.ai/hith3sh/grafana-monitoring)
\n- [Grafana HTTP API Documentation](https://grafana.com/docs/grafana/latest/developers/http_api/)
\n- [Grafana Dashboard API](https://grafana.com/docs/grafana/latest/developers/http_api/dashboard/)
\n- [Grafana Alerting API](https://grafana.com/docs/grafana/latest/developers/http_api/alerting/)
\n- [ClawLink OpenClaw Documentation](https://docs.claw-link.dev/openclaw)
\n\n\n## Skill Output:
\n**Output Type(s):** [guidance, shell commands, configuration, API calls, markdown]
\n**Output Format:** [Markdown with inline shell commands and JSON parameters]
\n**Output Parameters:** [1D]
\n**Other Properties Related to Output:** [Uses ClawLink tool calls and live Grafana tool discovery before execution.]
\n\n## Skill Version(s):
\n1.0.1 (source: server release evidence)
\n\n## Ethical Considerations:
\nUsers should evaluate whether this skill is appropriate for their environment, review any generated or modified files before relying on them, and apply their organization's safety, security, and compliance requirements before deployment.
\n\nArchive v0.1.1: 3 files, 5644 bytes\n\nFiles: skill-card.md (2547b), SKILL.md (14123b), _meta.json (137b)\n\nFile v0.1.1:SKILL.md\n\n---\nname: grafana-monitoring\ndescription: Grafana HTTP API integration. Inspect dashboards, folders, data sources, alert rules, and teams. Use this skill when users want to query observability data, inspect monitoring resources, or manage Grafana dashboards.\n---\n\n# Grafana\n\nAccess Grafana via the Grafana HTTP API with managed credentials. Inspect dashboards, folders, data sources, alert rules, teams, and observability resources.\n\nThis skill uses [ClawLink](https://claw-link.dev) for hosted connection flows and credentials so you do not need to configure Grafana API access yourself.\n\n### Setup in 3 Steps\n\n| Step 1: Install | Step 2: Pair Account | Step 3: Connect Grafana |\n|:---:|:---:|:---:|\n|  |  | *App-specific connection GIF coming soon* |\n| Run the install command in OpenClaw | Sign in and approve the device | Open the dashboard and connect Grafana |\n\n## How It Works\n\n```\n┌─────────────────┐ ┌──────────────┐ ┌──────────────────┐\n│ OpenClaw │────▶│ ClawLink │────▶│ Grafana │\n│ (User Chat) │ │ (OAuth) │ │ (HTTP API) │\n└─────────────────┘ └──────────────┘ └──────────────────┘\n │ │ │\n │ 1. Install Plugin │ │\n │ 2. Pair Device │ │\n │ 3. Connect Grafana │ │\n │ │ 4. Secure Token │\n │ │ 5. Proxy Requests │\n │ │ │\n ▼ ▼ ▼\n ┌──────────┐ ┌──────────┐ ┌──────────┐\n │ SKILL │ │ Dashboard│ │ Grafana │\n │ File │ │ Auth │ │ Cloud │\n └──────────┘ └──────────┘ └──────────┘\n```\n\n## Install\n\nInstall the verified ClawLink plugin from ClawHub. After the user confirms, complete the full setup so ClawLink tools are visible in the next OpenClaw chat.\n\n```bash\nopenclaw plugins install clawhub:clawlink-plugin\nopenclaw config set tools.alsoAllow '[\"clawlink-plugin\"]' --strict-json\nopenclaw gateway restart\n```\n\nThen tell the user: \"OpenClaw has been restarted. Send `/new` as a standalone message to start a fresh chat, then ask for Grafana again.\"\n\n## Quick Start\n\n```bash\n# List dashboards\nclawlink_call_tool --tool \"grafana_list_dashboards\" --params '{}'\n\n# Get a dashboard\nclawlink_call_tool --tool \"grafana_get_dashboard\" --params '{\"uid\": \"YOUR_DASHBOARD_UID\"}'\n\n# List folders\nclawlink_call_tool --tool \"grafana_list_folders\" --params '{}'\n```\n\n## Authentication\n\nAll Grafana tool calls are authenticated automatically by ClawLink using the configured Grafana credentials (API key or service account token).\n\n**No API key is required in chat.** ClawLink stores the credentials securely and injects them into every Grafana API request on the user's behalf.\n\n### Getting Connected\n\n1. Install the ClawLink plugin (see Install above).\n2. Pair the plugin with `clawlink_begin_pairing` if it is not configured yet.\n3. Open https://claw-link.dev/dashboard?add=grafana and connect Grafana.\n4. Call `clawlink_list_integrations` to verify the connection is active.\n\n## Connection Management\n\n### List Connections\n\n```bash\nclawlink_list_integrations\n```\n\n**Response:** Returns all connected integrations. Look for `grafana` in the list.\n\n### Verify Connection\n\n```bash\nclawlink_list_tools --integration grafana\n```\n\n**Response:** Returns the live tool catalog for Grafana.\n\n### Reconnect\n\nIf Grafana tools are missing or the connection shows an error:\n\n1. Direct the user to https://claw-link.dev/dashboard?add=grafana\n2. After they confirm, call `clawlink_list_integrations` to verify\n3. Then call `clawlink_list_tools --integration grafana`\n\n## Security & Permissions\n\n- Access is scoped to resources the configured Grafana API key or service account can access.\n- **All write operations require explicit user confirmation.** Before executing any create, update, or delete call, confirm the target resource and intended effect with the user.\n- Destructive actions (delete dashboard, delete folder, delete alert rule) are marked as high-impact and must be confirmed.\n\n## Tool Reference\n\n### Dashboard Operations\n\n| Tool | Description | Mode |\n|------|-------------|------|\n| `grafana_list_dashboards` | List all dashboards the user can access | Read |\n| `grafana_get_dashboard` | Get a dashboard by UID | Read |\n| `grafana_create_dashboard` | Create a new dashboard | Write |\n| `grafana_update_dashboard` | Update an existing dashboard | Write |\n| `grafana_delete_dashboard` | Delete a dashboard | Write |\n| `grafana_get_dashboard_permissions` | Get permissions for a dashboard | Read |\n| `grafana_update_dashboard_permissions` | Update dashboard permissions | Write |\n\n### Folder Management\n\n| Tool | Description | Mode |\n|------|-------------|------|\n| `grafana_list_folders` | List all folders | Read |\n| `grafana_get_folder` | Get a folder by UID | Read |\n| `grafana_create_folder` | Create a new folder | Write |\n| `grafana_update_folder` | Update a folder's title or UID | Write |\n| `grafana_delete_folder` | Delete a folder | Write |\n\n### Data Sources\n\n| Tool | Description | Mode |\n|------|-------------|------|\n| `grafana_list_datasources` | List all configured data sources | Read |\n| `grafana_get_datasource` | Get a data source by ID | Read |\n| `grafana_create_datasource` | Create a new data source | Write |\n| `grafana_update_datasource` | Update a data source | Write |\n| `grafana_delete_datasource` | Delete a data source | Write |\n\n### Alert Rules\n\n| Tool | Description | Mode |\n|------|-------------|------|\n| `grafana_list_alert_rules` | List all alert rules | Read |\n| `grafana_get_alert_rule` | Get a specific alert rule by UID | Read |\n| `grafana_create_alert_rule` | Create a new alert rule | Write |\n| `grafana_update_alert_rule` | Update an existing alert rule | Write |\n| `grafana_delete_alert_rule` | Delete an alert rule | Write |\n\n### Alert Instances\n\n| Tool | Description | Mode |\n|------|-------------|------|\n| `grafana_list_alert_instances` | List active alert instances | Read |\n\n### Teams\n\n| Tool | Description | Mode |\n|------|-------------|------|\n| `grafana_list_teams` | List all teams | Read |\n| `grafana_get_team` | Get a team by ID | Read |\n| `grafana_create_team` | Create a new team | Write |\n| `grafana_update_team` | Update a team | Write |\n| `grafana_delete_team` | Delete a team | Write |\n| `grafana_list_team_members` | List members of a team | Read |\n| `grafana_add_team_member` | Add a member to a team | Write |\n| `grafana_remove_team_member` | Remove a member from a team | Write |\n\n### Admin & Organization\n\n| Tool | Description | Mode |\n|------|-------------|------|\n| `grafana_get_organization` | Get current organization info | Read |\n| `grafana_list_organization_users` | List users in the current organization | Read |\n| `grafana_list_users` | List all users in Grafana | Read |\n| `grafana_get_user` | Get a user by ID | Read |\n\n## Code Examples\n\n### List dashboards\n\n```bash\nclawlink_call_tool --tool \"grafana_list_dashboards\" \\\n --params '{\n \"limit\": 50\n }'\n```\n\n### Get a dashboard\n\n```bash\nclawlink_call_tool --tool \"grafana_get_dashboard\" \\\n --params '{\n \"uid\": \"YOUR_DASHBOARD_UID\"\n }'\n```\n\n### Create a new dashboard\n\n```bash\nclawlink_call_tool --tool \"grafana_create_dashboard\" \\\n --params '{\n \"dashboard\": {\n \"title\": \"Service Health Overview\",\n \"tags\": [\"health\", \"overview\"],\n \"timezone\": \"browser\",\n \"panels\": []\n },\n \"folderUid\": \"YOUR_FOLDER_UID\"\n }'\n```\n\n### List folders\n\n```bash\nclawlink_call_tool --tool \"grafana_list_folders\" \\\n --params '{}'\n```\n\n### List data sources\n\n```bash\nclawlink_call_tool --tool \"grafana_list_datasources\" \\\n --params '{}'\n```\n\n### Create an alert rule\n\n```bash\nclawlink_call_tool --tool \"grafana_create_alert_rule\" \\\n --params '{\n \"title\": \"High Error Rate\",\n \"condition\": \"C\",\n \"data\": [\n {\"refId\": \"A\", \"queryType\": \"prometheus\"},\n {\"refId\": \"B\", \"queryType\": \"reduce\"},\n {\"refId\": \"C\", \"queryType\": \"threshold\"}\n ],\n \"folderUID\": \"YOUR_FOLDER_UID\"\n }'\n```\n\n## Discovery Workflow\n\n1. Call `clawlink_list_integrations` to confirm Grafana is connected.\n2. Call `clawlink_list_tools --integration grafana` to see the live catalog.\n3. Treat the returned list as the source of truth. Do not guess or assume what tools exist.\n4. If the user describes a capability but the exact tool is unclear, call `clawlink_search_tools` with a short query and integration `grafana`.\n5. If no Grafana tools appear, direct the user to https://claw-link.dev/dashboard?add=grafana.\n\n## Execution Workflow\n\n```\n┌─────────────────────────────────────────────────────────────┐\n│ READ OPERATIONS (Safe) │\n│ list → get → call │\n│ │\n│ Example: List dashboards → Get details → Show results │\n└─────────────────────────────────────────────────────────────┘\n │\n ▼\n┌─────────────────────────────────────────────────────────────┐\n│ WRITE OPERATIONS (Require Confirmation) │\n│ describe → preview → confirm → call │\n│ │\n│ Example: Describe tool → Preview → User approves │\n│ → Execute update │\n└─────────────────────────────────────────────────────────────┘\n```\n\n1. For unfamiliar tools, ambiguous requests, or any write action, call `clawlink_describe_tool` first.\n2. Use the returned guidance, schema, `whenToUse`, `askBefore`, `safeDefaults`, `examples`, and `followups` to shape the call.\n3. Prefer read, list, and get operations before writes.\n4. For writes or anything marked as requiring confirmation, call `clawlink_preview_tool` first.\n5. Execute with `clawlink_call_tool`. Pass confirmation only after the preview matches the user's intent.\n6. If the tool call fails, report the real error. Do not invent results or restate the failure as a missing capability unless the live catalog supports that conclusion.\n\n## Notes\n\n- Grafana supports both Grafana Cloud and self-hosted (OSS/Enterprise) instances.\n- API access requires an API key or service account token with appropriate roles.\n- Dashboard UIDs are the stable identifier for sharing and API calls.\n- Folder UIDs are used to organize dashboards and alert rules.\n- Alert rules must be placed in a folder and reference a data source.\n- Permissions for dashboards and folders can be configured to control access.\n\n## Error Handling\n\n| Status / Error | Meaning |\n|----------------|---------|\n| Tool not found | The tool name does not exist in the current catalog. Verify with `clawlink_list_tools --integration grafana`. |\n| Missing connection | Grafana is not connected. Direct the user to https://claw-link.dev/dashboard?add=grafana. |\n| `DASHBOARD_NOT_FOUND` | Dashboard does not exist. Check the UID. |\n| `INVALID_ARGUMENT` | Invalid parameter or missing required field. Review the tool schema with `clawlink_describe_tool`. |\n| `UNAUTHORIZED` | Grafana credentials are invalid or lack permissions. Check API key access. |\n| Write rejected | User did not confirm a write action. Always confirm before executing writes. |\n\n### Troubleshooting: Tools Not Visible\n\n1. Check that the ClawLink plugin is installed:\n ```bash\n openclaw plugins list\n ```\n2. If the plugin is installed but tools are missing, tell the user to send `/new` as a standalone message to reload the catalog.\n3. If a fresh chat does not help, run:\n ```bash\n openclaw config set tools.alsoAllow '[\"clawlink-plugin\"]' --strict-json\n openclaw gateway restart\n ```\n4. After restart, tell the user to send `/new` again and retry.\n\n### Troubleshooting: Invalid Tool Call\n\n1. Ensure the integration slug is exactly `grafana`.\n2. Use `clawlink_describe_tool` to verify parameter names and types before calling.\n3. For write operations, always call `clawlink_preview_tool` first.\n\n## Resources\n\n- [Grafana HTTP API Documentation](https://grafana.com/docs/grafana/latest/developers/http_api/)\n- [Dashboard API](https://grafana.com/docs/grafana/latest/developers/http_api/dashboard/)\n- [Alerting API](https://grafana.com/docs/grafana/latest/developers/http_api/alerting/)\n- ClawLink: https://claw-link.dev\n- ClawLink Docs: https://docs.claw-link.dev/openclaw\n- ClawLink Verification: https://claw-link.dev/verify\n\n---\n\n**Powered by [ClawLink](https://claw-link.dev)** — an integration hub for OpenClaw\n\n\n\nFile v0.1.1:_meta.json\n\n{\n \"ownerId\": \"kn713pxvayh8fjhb503zjb8yxh815j54\",\n \"slug\": \"grafana-monitoring\",\n \"version\": \"0.1.1\",\n \"publishedAt\": 1780839097852\n}\n\nFile v0.1.1:skill-card.md\n\n## Description:
\nGrafana HTTP API integration. Inspect dashboards, folders, data sources, alert rules, and teams. Use this skill when users want to query observability data, inspect monitoring resources, or manage Grafana dashboards.
\n\nThis skill is ready for commercial/non-commercial use.
\n\n## Publisher:
\n[hith3sh](https://clawhub.ai/user/hith3sh)
\n\n### License/Terms of Use:
\nMIT-0
\n\n\n## Use Case:
\nDevelopers and operators use this skill to inspect and manage Grafana dashboards, folders, data sources, alert rules, teams, users, and related observability resources through ClawLink-backed Grafana API tools.
\n\n### Deployment Geography for Use:
\nGlobal
\n\n## Known Risks and Mitigations:
\nRisk: The skill requires ClawLink to broker sensitive Grafana credentials.
\nMitigation: Install only when the user trusts ClawLink, and use least-privilege Grafana API keys or service account tokens.
\nRisk: Write and destructive Grafana operations can change or delete dashboards, folders, data sources, alert rules, teams, users, or permissions.
\nMitigation: Preview and explicitly confirm the target resource and intended effect before any create, update, or delete operation.
\n\n\n## Reference(s):
\n- [ClawHub skill page](https://clawhub.ai/hith3sh/grafana-monitoring)
\n- [Grafana HTTP API documentation](https://grafana.com/docs/grafana/latest/developers/http_api/)
\n- [Grafana Dashboard API](https://grafana.com/docs/grafana/latest/developers/http_api/dashboard/)
\n- [Grafana Alerting API](https://grafana.com/docs/grafana/latest/developers/http_api/alerting/)
\n- [ClawLink OpenClaw documentation](https://docs.claw-link.dev/openclaw)
\n- [ClawLink verification](https://claw-link.dev/verify)
\n\n\n## Skill Output:
\n**Output Type(s):** [text, markdown, shell commands, configuration, guidance]
\n**Output Format:** [Markdown with inline shell commands and JSON tool parameters]
\n**Output Parameters:** [1D]
\n**Other Properties Related to Output:** [May include Grafana API tool names, JSON request parameters, setup commands, connection checks, and confirmation guidance for write operations.]
\n\n## Skill Version(s):
\n0.1.1 (source: server release evidence)
\n\n## Ethical Considerations:
\nUsers should evaluate whether this skill is appropriate for their environment, review any generated or modified files before relying on them, and apply their organization's safety, security, and compliance requirements before deployment.
\n\nArchive v0.1.0: 3 files, 3450 bytes\n\nFiles: skill-card.md (2356b), SKILL.md (4959b), _meta.json (137b)\n\nFile v0.1.0:SKILL.md\n\n---\nname: grafana-monitoring\ndescription: Inspect Grafana dashboards, folders, data sources, alerts, teams, and observability resources - powered by ClawLink.\n---\n\n# Grafana\n\nWork with Grafana from chat - inspect dashboards, folders, data sources, alerts, teams, and observability resources.\n\nPowered by [ClawLink](https://claw-link.dev), an integration hub for OpenClaw that handles hosted connection flows and credentials so you don't need to configure Grafana API access yourself.\n\n## Quick start\n\n1. Install the verified ClawLink plugin: `openclaw plugins install clawhub:clawlink-plugin`\n2. Start a fresh OpenClaw chat if the plugin was just installed and ClawLink tools are not visible yet\n3. If ClawLink is not configured, call `clawlink_begin_pairing`\n4. Tell the user to open the returned pairing URL, sign in to ClawLink if needed, and approve the device\n5. After the user confirms approval, call `clawlink_get_pairing_status`\n6. Tell the user to connect Grafana at [claw-link.dev/dashboard?add=grafana](https://claw-link.dev/dashboard?add=grafana)\n7. When the user confirms Grafana is connected, call `clawlink_list_integrations` and then `clawlink_list_tools` with the `grafana` integration slug\n\n## Setup details\n\n### Installing the plugin\n\nIf the ClawLink plugin is not installed yet, tell the user to run:\n\n```\nopenclaw plugins install clawhub:clawlink-plugin\n```\n\nIf the current chat started before the plugin was installed and ClawLink tools are still unavailable, tell the user to start a fresh chat so OpenClaw reloads the plugin tool catalog.\n\n### Pairing ClawLink\n\nIf ClawLink reports that the plugin is not configured, the plugin has not been paired with the user's ClawLink account yet.\n\n1. Call `clawlink_begin_pairing`.\n2. Tell the user to open the returned pairing URL in their browser.\n3. The user signs in to ClawLink if needed and approves the OpenClaw device.\n4. After the user confirms approval, call `clawlink_get_pairing_status` to finish local setup.\n\nThe resulting device credential is stored locally in OpenClaw's plugin config and is only sent to `claw-link.dev`. The user should not paste raw credentials into chat.\n\n### Connecting Grafana\n\nTell the user to open https://claw-link.dev/dashboard?add=grafana and connect Grafana there. The page opens the add-connection panel filtered to Grafana. ClawLink's hosted page runs the provider connection flow. When they confirm it is done, call `clawlink_list_integrations` to verify, then call `clawlink_list_tools` with integration `grafana`.\n\n## Using Grafana tools\n\nClawLink provides tools dynamically based on what the user has connected. You do not need to know tool names or schemas in advance.\n\n### Discovery\n\n1. Call `clawlink_list_integrations` to confirm Grafana is connected.\n2. Call `clawlink_list_tools` with integration `grafana`.\n3. Treat the returned list as the source of truth. Do not guess or assume what tools exist.\n4. If the user describes a capability but the exact tool is unclear, call `clawlink_search_tools` with a short query and integration `grafana`.\n5. If no Grafana tools appear, direct the user to https://claw-link.dev/dashboard?add=grafana.\n\n### Execution\n\n1. Call `clawlink_describe_tool` before using an unfamiliar tool, before any write, or when the request is ambiguous.\n2. Use the returned schema, `whenToUse`, `askBefore`, `safeDefaults`, `examples`, and `followups`.\n3. Prefer read, list, search, and get operations before writes.\n4. For writes or anything marked as requiring confirmation, call `clawlink_preview_tool` first, then confirm with the user.\n5. Execute with `clawlink_call_tool`.\n6. If it fails, report the real error. Do not invent results or restate the failure as a missing capability unless the live catalog supports that conclusion.\n\n## What you can do\n\nTypical Grafana tasks (actual availability depends on the user's connected account, permissions, scopes, and current ClawLink tool catalog):\n\n- List dashboards, folders, and data sources\n- Inspect dashboard and panel metadata\n- Query or review alert rules when available\n- Create or update dashboards after confirmation\n- Manage teams or folders when supported\n\n## Rules\n\n- Always use ClawLink tools for Grafana. Do not ask the user for separate Grafana credentials.\n- Do not claim a capability is missing without checking the live ClawLink catalog in the current turn.\n- Do not invent slash commands or ask the user to paste raw credentials.\n- Ask for confirmation before destructive, external-facing, or bulk write actions.\n- If Grafana is not connected, direct the user to https://claw-link.dev/dashboard?add=grafana.\n- Never echo or repeat the user's ClawLink credential.\n\n## Resources\n\n- ClawLink: https://claw-link.dev\n- ClawLink Docs: https://docs.claw-link.dev/openclaw\n- ClawLink Verification: https://claw-link.dev/verify\n- ClawLink Source: https://github.com/hith3sh/clawlink\n- Grafana API: https://grafana.com/docs/grafana/latest/developers/http_api/\n\nFile v0.1.0:_meta.json\n\n{\n \"ownerId\": \"kn713pxvayh8fjhb503zjb8yxh815j54\",\n \"slug\": \"grafana-monitoring\",\n \"version\": \"0.1.0\",\n \"publishedAt\": 1778958815073\n}\n\nFile v0.1.0:skill-card.md\n\n## Description:
\nInspect Grafana dashboards, folders, data sources, alerts, teams, and observability resources - powered by ClawLink.
\n\nThis skill is ready for commercial/non-commercial use.
\n\n## Publisher:
\n[hith3sh](https://clawhub.ai/user/hith3sh)
\n\n### License/Terms of Use:
\nMIT-0
\n\n\n## Use Case:
\nDevelopers, SREs, and observability teams use this skill to inspect and manage Grafana resources from chat through ClawLink-connected tools.
\n\n### Deployment Geography for Use:
\nGlobal
\n\n## Known Risks and Mitigations:
\nRisk: The skill routes Grafana setup and actions through ClawLink, which requires trust in ClawLink and its access to the user's Grafana account.
\nMitigation: Install only when ClawLink is trusted, review connection scopes, and use least-privilege Grafana permissions.
\nRisk: Grafana write actions can affect dashboards, folders, teams, alerts, or other shared observability resources.
\nMitigation: Preview and explicitly confirm write, destructive, external-facing, or bulk actions before execution.
\nRisk: Credential mishandling could expose ClawLink device credentials or Grafana access.
\nMitigation: Do not ask users to paste raw credentials, never echo ClawLink credentials, and rely on the hosted ClawLink connection flow.
\n\n\n## Reference(s):
\n- [ClawLink](https://claw-link.dev)
\n- [ClawLink Docs](https://docs.claw-link.dev/openclaw)
\n- [ClawLink Verification](https://claw-link.dev/verify)
\n- [Grafana API](https://grafana.com/docs/grafana/latest/developers/http_api/)
\n\n\n## Skill Output:
\n**Output Type(s):** [guidance, shell commands, configuration, API calls]
\n**Output Format:** [Markdown with inline commands and tool-call guidance]
\n**Output Parameters:** [1D]
\n**Other Properties Related to Output:** [Uses the live ClawLink Grafana tool catalog as the source of truth and requires confirmation before destructive, external-facing, or bulk write actions.]
\n\n## Skill Version(s):
\n0.1.0 (source: server release metadata)
\n\n## Ethical Considerations:
\nUsers should evaluate whether this skill is appropriate for their environment, review any generated or modified files before relying on them, and apply their organization's safety, security, and compliance requirements before deployment.
","readmeExcerpt":"Skill: Grafana Owner: hith3sh Summary: Grafana HTTP API integration. Inspect dashboards, folders, data sources, alert rules, and teams. Use this skill when users want to query observability data,... Tags: latest:1.0.6 Version history: v1.0.6 | 2026-06-09T07:11:23.286Z | user Add UTM attribution tags (utm_source=clawhub) to ClawLink branding links so visits from this skill page are tracked as a distinct traffic source","codeSnippets":[],"executableExamples":[{"language":"text","snippet":"┌─────────────────┐ ┌──────────────┐ ┌──────────────────┐\n│ OpenClaw │────▶│ ClawLink │────▶│ Grafana │\n│ (User Chat) │ │ (OAuth) │ │ (HTTP API) │\n└─────────────────┘ └──────────────┘ └──────────────────┘\n │ │ │\n │ 1. Install Plugin │ │\n │ 2. Pair Device │ │\n │ 3. Connect Grafana │ │\n │ │ 4. Secure Token │\n │ │ 5. Proxy Requests │\n │ │ │\n ▼ ▼ ▼\n ┌──────────┐ ┌──────────┐ ┌──────────┐\n │ SKILL │ │ Dashboard│ │ Grafana │\n │ File │ │ Auth │ │ Cloud │\n └──────────┘ └──────────┘ └──────────┘"},{"language":"bash","snippet":"openclaw plugins install clawhub:clawlink-plugin\nopenclaw config set tools.alsoAllow '[\"clawlink-plugin\"]' --strict-json\nopenclaw gateway restart"},{"language":"bash","snippet":"# List dashboards\nclawlink_call_tool --tool \"grafana_list_dashboards\" --params '{}'\n\n# Get a dashboard\nclawlink_call_tool --tool \"grafana_get_dashboard\" --params '{\"uid\": \"YOUR_DASHBOARD_UID\"}'\n\n# List folders\nclawlink_call_tool --tool \"grafana_list_folders\" --params '{}'"},{"language":"bash","snippet":"clawlink_list_integrations"},{"language":"bash","snippet":"clawlink_list_tools --integration grafana"},{"language":"bash","snippet":"clawlink_call_tool --tool \"grafana_list_dashboards\" \\\n --params '{\n \"limit\": 50\n }'"}],"parameters":null,"dependencies":[],"permissions":[],"extractedFiles":[{"path":"SKILL.md","content":"---\nname: grafana-monitoring\ndescription: Grafana HTTP API integration. Inspect dashboards, folders, data sources, alert rules, and teams. Use this skill when users want to query observability data, inspect monitoring resources, or manage Grafana dashboards.\n---\n\n# Grafana\n\n\n\nAccess Grafana via the Grafana HTTP API with managed credentials. Inspect dashboards, folders, data sources, alert rules, teams, and observability resources.\n\nThis skill uses [ClawLink](https://claw-link.dev/?utm_source=clawhub&utm_medium=referral&utm_content=grafana-monitoring) for hosted connection flows and credentials so you do not need to configure Grafana API access yourself.\n\n### Setup in 3 Steps\n\n| Step 1: Install | Step 2: Pair Account | Step 3: Connect Grafana |\n|:---:|:---:|:---:|\n|  |  | *App-specific connection GIF coming soon* |\n| Run the install command in OpenClaw | Sign in and approve the device | Open the dashboard and connect Grafana |\n\n## How It Works\n\n```\n┌─────────────────┐ ┌──────────────┐ ┌──────────────────┐\n│ OpenClaw │────▶│ ClawLink │────▶│ Grafana │\n│ (User Chat) │ │ (OAuth) │ │ (HTTP API) │\n└─────────────────┘ └──────────────┘ └──────────────────┘\n │ │ │\n │ 1. Install Plugin │ │\n │ 2. Pair Device │ │\n │ 3. Connect Grafana │ │\n │ │ 4. Secure Token │\n │ │ 5. Proxy Requests │\n │ │ │\n ▼ ▼ ▼\n ┌──────────┐ ┌──────────┐ ┌──────────┐\n │ SKILL │ │ Dashboard│ │ Grafana │\n │ File │ │ Auth │ │ Cloud │\n └──────────┘ └──────────┘ └──────────┘\n```\n\n## Install\n\nInstall the verified ClawLink plugin from ClawHub. After the user confirms, complete the full setup so ClawLink tools are visible in the next OpenClaw chat.\n\n```bash\nopenclaw plugins install clawhub:clawlink-plugin\nopenclaw config set tools.alsoAllow '[\"clawlink-plugin\"]' --strict-json\nopenclaw gateway restart\n```\n\nThen tell the user: \"OpenClaw has been restarted. Send `/new` as a standalone message to start a fresh chat, then ask for Grafana again.\"\n\n## Quick Start\n\n```bash\n# List dashboards\nclawlink_call_tool --tool \"grafana_list_dashboards\" --params '{}'\n\n# Get a dashboard\nclawlink_call_tool --tool \"grafana_get_dashboard\" --params '{\"uid\": \"YOUR_DASHBOARD_UID\"}'\n\n# List folders\nclawlink_call_tool -"},{"path":"_meta.json","content":"{\n \"ownerId\": \"kn713pxvayh8fjhb503zjb8yxh815j54\",\n \"slug\": \"grafana-monitoring\",\n \"version\": \"1.0.6\",\n \"publishedAt\": 1780989083286\n}"},{"path":"skill-card.md","content":"## Description:\n\nGrafana HTTP API integration. Inspect dashboards, folders, data sources, alert rules, and teams. Use this skill when users want to query observability data, inspect monitoring resources, or manage Grafana dashboards.\n\nThis skill is ready for commercial/non-commercial use.\n\n## Publisher:\n\n[hith3sh](https://clawhub.ai/user/hith3sh)\n\n### License/Terms of Use:\n\nMIT-0\n\n## Use Case:\n\nDevelopers and operations engineers use this skill to inspect Grafana observability resources and manage dashboards, folders, data sources, alert rules, and teams through authenticated Grafana API tools.\n\n### Deployment Geography for Use:\n\nGlobal\n\n## Known Risks and Mitigations:\n\nRisk: Connected Grafana credentials can expose or change resources within the API key or service account permissions.\n\nMitigation: Use a least-privilege Grafana API key or service account and review the connected credential scope before installation.\n\nRisk: Create, update, or delete operations can modify dashboards, folders, data sources, alert rules, teams, or permissions.\n\nMitigation: Preview write actions and require explicit user confirmation of the target resource and intended effect before execution.\n\n## Reference(s):\n\n- [Grafana HTTP API Documentation](https://grafana.com/docs/grafana/latest/developers/http_api/)\n- [Grafana Dashboard API](https://grafana.com/docs/grafana/latest/developers/http_api/dashboard/)\n- [Grafana Alerting API](https://grafana.com/docs/grafana/latest/developers/http_api/alerting/)\n- [ClawLink OpenClaw Documentation](https://docs.claw-link.dev/openclaw)\n- [ClawHub Skill Page](https://clawhub.ai/hith3sh/skills/grafana-monitoring)\n\n## Skill Output:\n\n**Output Type(s):** [Text, Markdown, Shell commands, Configuration, Guidance]\n\n**Output Format:** [Markdown with inline shell commands and JSON tool parameters]\n\n**Output Parameters:** [1D]\n\n**Other Properties Related to Output:** [May produce Grafana API tool-call guidance, connection checks, write previews, and troubleshooting steps.]\n\n## Skill Version(s):\n\n1.0.6 (source: ClawHub release evidence)\n\n## Ethical Considerations:\n\nUsers should evaluate whether this skill is appropriate for their environment, review any generated or modified files before relying on them, and apply their organization's safety, security, and compliance requirements before deployment."}],"languages":[],"docsSourceLabel":"CLAWHUB","editorialOverview":"Grafana HTTP API integration. Inspect dashboards, folders, data sources, alert rules, and teams. Use this skill when users want to query observability data,... Skill: Grafana Owner: hith3sh Summary: Grafana HTTP API integration. Inspect dashboards, folders, data sources, alert rules, and teams. Use this skill when users want to query observability data,... Tags: latest:1.0.6 Version history: v1.0.6 | 2026-06-09T07:11:23.286Z | user Add UTM attribution tags (utm_source=clawhub) to ClawLink branding links so visits from this skill page are tracked as a distinct traffic source","editorialQuality":{"score":100,"threshold":65,"status":"ready","wordCount":1019,"uniquenessScore":50,"reasons":[]}},"media":{"evidence":{"source":"no-media","verified":false,"confidence":"low","updatedAt":"2026-10-09T11:26:16.804Z","emptyReason":"No screenshots, media assets, or demo links are available."},"primaryImageUrl":null,"mediaAssetCount":0,"assets":[],"demoUrl":null},"ownerResources":{"evidence":{"source":"unclaimed","verified":false,"confidence":"low","updatedAt":"2026-10-09T11:26:16.804Z","emptyReason":"This page has not been claimed by the agent owner."},"hasCustomPage":false,"customPageUpdatedAt":null,"customLinks":[],"structuredLinks":{"docsUrl":null,"demoUrl":null,"supportUrl":null,"pricingUrl":null,"statusUrl":null},"customPage":null},"relatedAgents":{"evidence":{"source":"protocol-neighbors","verified":false,"confidence":"medium","updatedAt":"2026-10-10T07:07:52.641Z","emptyReason":null},"items":[{"id":"8ebccd8e-3863-4187-8355-c3f14e1f9edf","entityType":"agent","canonicalPath":"/agent/iofficeai-aionui","slug":"iofficeai-aionui","name":"AionUi","description":"Free, local, open-source 24/7 Cowork app and OpenClaw for Gemini CLI, Claude Code, Codex, OpenCode, Qwen Code, Goose CLI, Auggie, and more | 🌟 Star if you like it!","url":"https://github.com/iOfficeAI/AionUi","homepage":"https://www.aionui.com","source":"GITHUB_REPOS","protocols":["MCP","OPENCLAW"],"capabilities":[],"safetyScore":100,"overallRank":70,"updatedAt":"2026-10-09T19:11:12.944Z","createdAt":"2026-02-25T03:38:16.584Z","downloads":null},{"id":"b917f68a-ebff-438e-84f8-3f4b2494c0bc","entityType":"agent","canonicalPath":"/agent/activepieces-activepieces","slug":"activepieces-activepieces","name":"activepieces","description":"AI Agents & MCPs & AI Workflow Automation • (~400 MCP servers for AI agents) • AI Automation / AI Agent with MCPs • AI Workflows & AI Agents • MCPs for AI Agents","url":"https://github.com/activepieces/activepieces","homepage":"https://www.activepieces.com","source":"GITHUB_REPOS","protocols":["OPENCLAW"],"capabilities":[],"safetyScore":100,"overallRank":70,"updatedAt":"2026-04-15T02:22:12.426Z","createdAt":"2026-02-25T03:38:12.412Z","downloads":null},{"id":"5cb26759-3a39-483f-94cf-276a98c13bb8","entityType":"agent","canonicalPath":"/agent/cherryhq-cherry-studio","slug":"cherryhq-cherry-studio","name":"cherry-studio","description":"AI productivity studio with smart chat, autonomous agents, and 300+ assistants. Unified access to frontier LLMs","url":"https://github.com/CherryHQ/cherry-studio","homepage":"https://cherry-ai.com","source":"GITHUB_REPOS","protocols":["MCP","OPENCLAW"],"capabilities":[],"safetyScore":100,"overallRank":70,"updatedAt":"2026-04-11T14:38:40.986Z","createdAt":"2026-02-25T03:38:19.379Z","downloads":null},{"id":"6f6582d0-5d76-4f0f-b81d-86520247950b","entityType":"agent","canonicalPath":"/agent/copilotkit-copilotkit","slug":"copilotkit-copilotkit","name":"CopilotKit","description":"The Frontend for Agents & Generative UI. React + Angular","url":"https://github.com/CopilotKit/CopilotKit","homepage":"https://docs.copilotkit.ai","source":"GITHUB_REPOS","protocols":["OPENCLAW"],"capabilities":[],"safetyScore":100,"overallRank":70,"updatedAt":"2026-03-25T09:50:57.846Z","createdAt":"2026-02-25T03:39:14.617Z","downloads":null}],"links":{"hub":"/agent","source":"/agent/source/clawhub","protocols":[{"label":"OpenClaw","href":"/agent/protocol/openclew"}]}}}