
Grafana
Grafana HTTP API integration. Inspect dashboards, folders, data sources, alert rules, and teams. Use this skill when users want to query observability data,... Skill: Grafana Owner: hith3sh Summary: Grafana HTTP API integration. Inspect dashboards, folders, data sources, alert rules, and teams. Use this skill when users want to query observability data,... Tags: latest:1.0.6 Version history: v1.0.6 | 2026-06-09T07:11:23.286Z | user Add UTM attribution tags (utm_source=clawhub) to ClawLink branding links so visits from this skill page are tracked as a distinct traffic source
Rank
62
Safety
84
Downloads
2.8k
Updated
Oct 9, 2026
Version
1.0.6
Source
CLAWHUB
About
What it does, and when to use it.
Capability contract not published. No trust telemetry is available yet. 2.8K downloads reported by the source. Last updated 10/9/2026.
Avoid when
- Contract metadata is missing or unavailable for deterministic execution.
Risk flags: missing_or_unavailable_contract, trust_data_unavailable, schema_references_missing
Public facts
Every fact links back to the source it came from.
- Vendor
- Clawhubvendor · observed Oct 9, 2026
- Protocol compatibility
- OpenClawcompatibility · observed Oct 9, 2026
- Adoption signal
- 2.8K downloadsadoption · observed Oct 9, 2026
- Latest release
- 1.0.6release · observed Jun 9, 2026
- Handshake status
- UNKNOWNsecurity
Install and run
Setup complexity: low.
clawhub skill install s173vws87a7ss71xf9rq53k5gd8568kv:grafana-monitoring- Setup complexity is classified as HIGH. You must provision dedicated cloud infrastructure or an isolated VM. Do not run this directly on your local workstation.
- Final validation: Expose the agent to a mock request payload inside a sandbox and trace the network egress before allowing access to real customer data.
Contract: missing
curl -s "https://www.xpersona.co/api/v1/agents/clawhub-hith3sh-grafana-monitoring/snapshot"
Documentation
CLAWHUB
89,120 characters of source documentation, loaded on request.
Extracted files
3 files captured from the source.
SKILL.md
---
name: grafana-monitoring
description: Grafana HTTP API integration. Inspect dashboards, folders, data sources, alert rules, and teams. Use this skill when users want to query observability data, inspect monitoring resources, or manage Grafana dashboards.
---
# Grafana

Access Grafana via the Grafana HTTP API with managed credentials. Inspect dashboards, folders, data sources, alert rules, teams, and observability resources.
This skill uses [ClawLink](https://claw-link.dev/?utm_source=clawhub&utm_medium=referral&utm_content=grafana-monitoring) for hosted connection flows and credentials so you do not need to configure Grafana API access yourself.
### Setup in 3 Steps
| Step 1: Install | Step 2: Pair Account | Step 3: Connect Grafana |
|:---:|:---:|:---:|
| 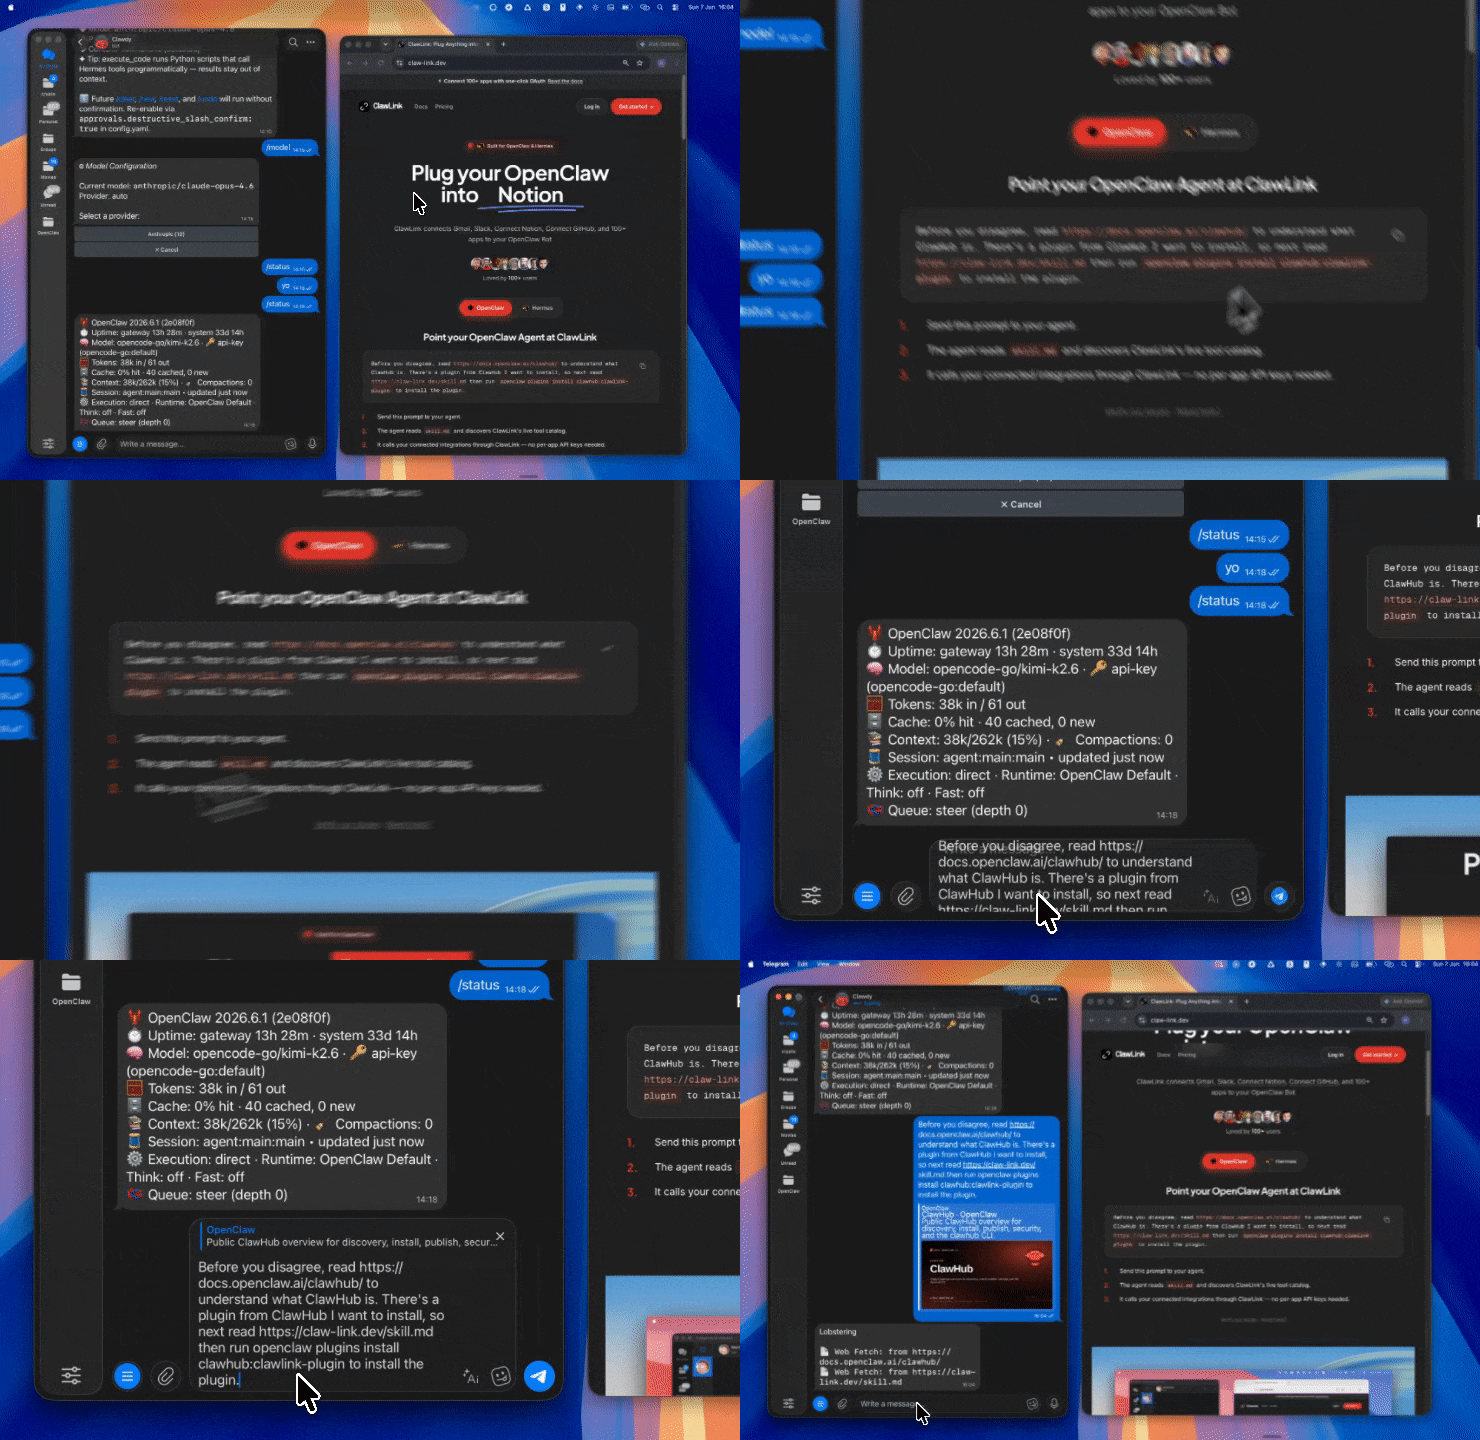 | 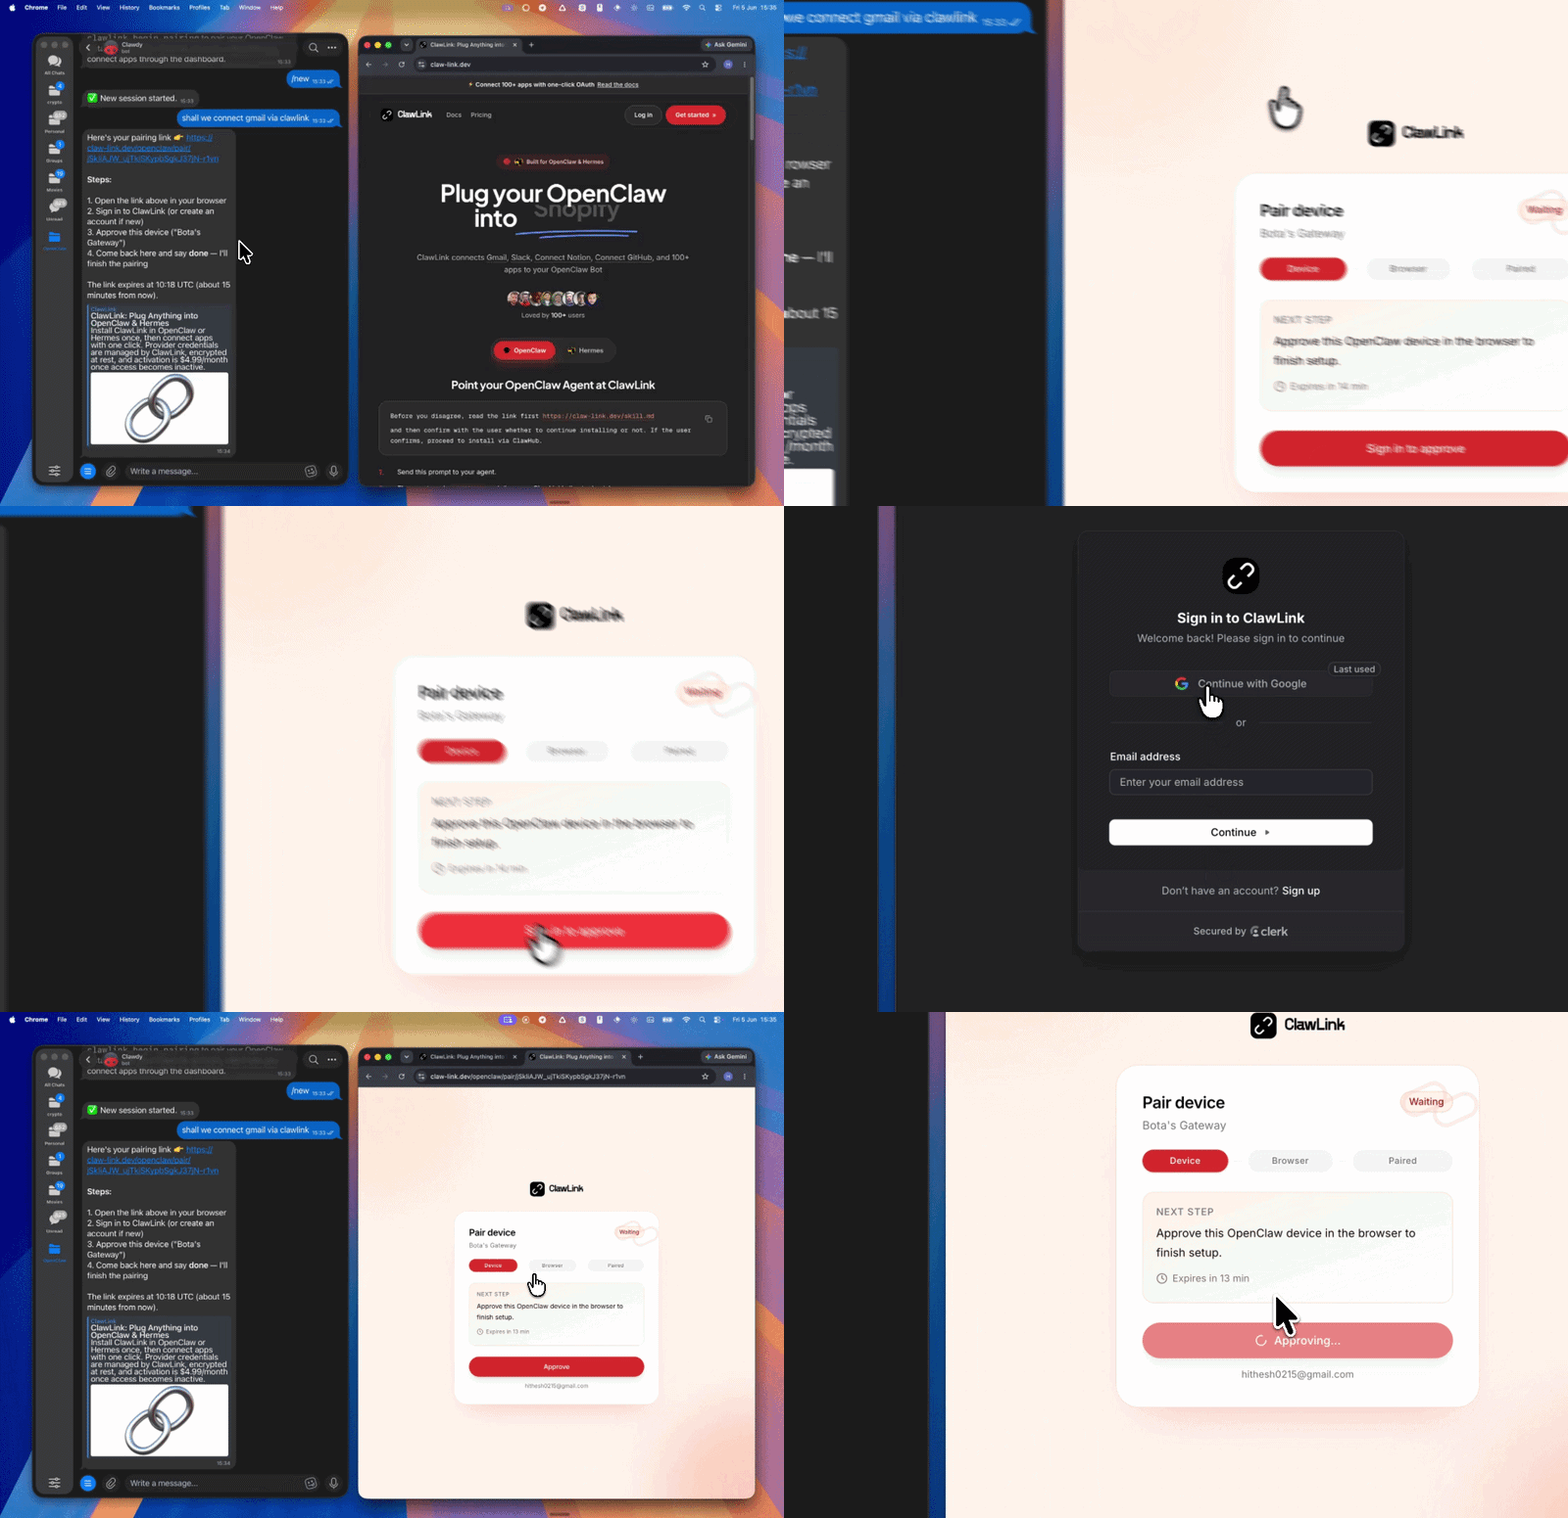 | *App-specific connection GIF coming soon* |
| Run the install command in OpenClaw | Sign in and approve the device | Open the dashboard and connect Grafana |
## How It Works
```
┌─────────────────┐ ┌──────────────┐ ┌──────────────────┐
│ OpenClaw │────▶│ ClawLink │────▶│ Grafana │
│ (User Chat) │ │ (OAuth) │ │ (HTTP API) │
└─────────────────┘ └──────────────┘ └──────────────────┘
│ │ │
│ 1. Install Plugin │ │
│ 2. Pair Device │ │
│ 3. Connect Grafana │ │
│ │ 4. Secure Token │
│ │ 5. Proxy Requests │
│ │ │
▼ ▼ ▼
┌──────────┐ ┌──────────┐ ┌──────────┐
│ SKILL │ │ Dashboard│ │ Grafana │
│ File │ │ Auth │ │ Cloud │
└──────────┘ └──────────┘ └──────────┘
```
## Install
Install the verified ClawLink plugin from ClawHub. After the user confirms, complete the full setup so ClawLink tools are visible in the next OpenClaw chat.
```bash
openclaw plugins install clawhub:clawlink-plugin
openclaw config set tools.alsoAllow '["clawlink-plugin"]' --strict-json
openclaw gateway restart
```
Then tell the user: "OpenClaw has been restarted. Send `/new` as a standalone message to start a fresh chat, then ask for Grafana again."
## Quick Start
```bash
# List dashboards
clawlink_call_tool --tool "grafana_list_dashboards" --params '{}'
# Get a dashboard
clawlink_call_tool --tool "grafana_get_dashboard" --params '{"uid": "YOUR_DASHBOARD_UID"}'
# List folders
clawlink_call_tool -_meta.json
{
  "ownerId": "kn713pxvayh8fjhb503zjb8yxh815j54",
  "slug": "grafana-monitoring",
  "version": "1.0.6",
  "publishedAt": 1780989083286
}
skill-card.md
## Description:

Grafana HTTP API integration. Inspect dashboards, folders, data sources, alert rules, and teams. Use this skill when users want to query observability data, inspect monitoring resources, or manage Grafana dashboards.

This skill is ready for commercial/non-commercial use.

## Publisher:

[hith3sh](https://clawhub.ai/user/hith3sh)

### License/Terms of Use:

MIT-0

## Use Case:

Developers and operations engineers use this skill to inspect Grafana observability resources and manage dashboards, folders, data sources, alert rules, and teams through authenticated Grafana API tools.

### Deployment Geography for Use:

Global

## Known Risks and Mitigations:

Risk: Connected Grafana credentials can expose or change resources within the API key or service account permissions.

Mitigation: Use a least-privilege Grafana API key or service account and review the connected credential scope before installation.

Risk: Create, update, or delete operations can modify dashboards, folders, data sources, alert rules, teams, or permissions.

Mitigation: Preview write actions and require explicit user confirmation of the target resource and intended effect before execution.

## Reference(s):

- [Grafana HTTP API Documentation](https://grafana.com/docs/grafana/latest/developers/http_api/)
- [Grafana Dashboard API](https://grafana.com/docs/grafana/latest/developers/http_api/dashboard/)
- [Grafana Alerting API](https://grafana.com/docs/grafana/latest/developers/http_api/alerting/)
- [ClawLink OpenClaw Documentation](https://docs.claw-link.dev/openclaw)
- [ClawHub Skill Page](https://clawhub.ai/hith3sh/skills/grafana-monitoring)

## Skill Output:

**Output Type(s):** [Text, Markdown, Shell commands, Configuration, Guidance]

**Output Format:** [Markdown with inline shell commands and JSON tool parameters]

**Output Parameters:** [1D]

**Other Properties Related to Output:** [May produce Grafana API tool-call guidance, connection checks, write previews, and troubleshooting steps.]

## Skill Version(s):

1.0.6 (source: ClawHub release evidence)

## Ethical Considerations:

Users should evaluate whether this skill is appropriate for their environment, review any generated or modified files before relying on them, and apply their organization's safety, security, and compliance requirements before deployment.
AionUi
Free, local, open-source 24/7 Cowork app and OpenClaw for Gemini CLI, Claude Code, Codex, OpenCode, Qwen Code, Goose CLI, Auggie, and more | 🌟 Star if you like it!
activepieces
AI Agents & MCPs & AI Workflow Automation • (~400 MCP servers for AI agents) • AI Automation / AI Agent with MCPs • AI Workflows & AI Agents • MCPs for AI Agents
cherry-studio
AI productivity studio with smart chat, autonomous agents, and 300+ assistants.
CopilotKit
The Frontend for Agents & Generative UI. React + Angular
Machine-readable data
The same record, as JSON, for agents and crawlers.
{
  "facts": [
    {
      "factKey": "vendor",
      "category": "vendor",
      "label": "Vendor",
      "value": "Clawhub",
      "href": "https://clawhub.ai/hith3sh/skills/grafana-monitoring",
      "sourceUrl": "https://clawhub.ai/hith3sh/skills/grafana-monitoring",
      "sourceType": "profile",
      "confidence": "medium",
      "observedAt": "2026-10-09T11:26:16.804Z",
      "isPublic": true
    },
    {
      "factKey": "protocols",
      "category": "compatibility",
      "label": "Protocol compatibility",
      "value": "OpenClaw",
      "href": "https://www.xpersona.co/api/v1/agents/clawhub-hith3sh-grafana-monitoring/contract",
      "sourceUrl": "https://www.xpersona.co/api/v1/agents/clawhub-hith3sh-grafana-monitoring/contract",
      "sourceType": "contract",
      "confidence": "medium",
      "observedAt": "2026-10-09T11:26:16.804Z",
      "isPublic": true
    },
    {
      "factKey": "traction",
      "category": "adoption",
      "label": "Adoption signal",
      "value": "2.8K downloads",
      "href": "https://clawhub.ai/hith3sh/grafana-monitoring",
      "sourceUrl": "https://clawhub.ai/hith3sh/grafana-monitoring",
      "sourceType": "profile",
      "confidence": "medium",
      "observedAt": "2026-10-09T11:26:16.804Z",
      "isPublic": true
    },
    {
      "factKey": "latest_release",
      "category": "release",
      "label": "Latest release",
      "value": "1.0.6",
      "href": "https://clawhub.ai/hith3sh/grafana-monitoring",
      "sourceUrl": "https://clawhub.ai/hith3sh/grafana-monitoring",
      "sourceType": "release",
      "confidence": "medium",
      "observedAt": "2026-06-09T07:11:23.286Z",
      "isPublic": true
    },
    {
      "factKey": "handshake_status",
      "category": "security",
      "label": "Handshake status",
      "value": "UNKNOWN",
      "href": "https://www.xpersona.co/api/v1/agents/clawhub-hith3sh-grafana-monitoring/trust",
      "sourceUrl": "https://www.xpersona.co/api/v1/agents/clawhub-hith3sh-grafana-monitoring/trust",
      "sourceType": "trust",
      "confidence": "medium",
      "observedAt": null,
      "isPublic": true
    }
  ],
  "events": [
    {
      "eventType": "release",
      "title": "Release 1.0.6",
      "description": "Add UTM attribution tags (utm_source=clawhub) to ClawLink branding links so visits from this skill page are tracked as a distinct traffic source.",
      "href": "https://clawhub.ai/hith3sh/grafana-monitoring",
      "sourceUrl": "https://clawhub.ai/hith3sh/grafana-monitoring",
      "sourceType": "release",
      "confidence": "medium",
      "observedAt": "2026-06-09T07:11:23.286Z",
      "isPublic": true
    }
  ]
}
Record generated Oct 10, 2026.