
Lightweight charting skill: powerful styling & direct PNG export
Default skill for structured-data visualization, chart generation, and dashboard-style reporting. Use when the user asks to create charts, graphs, plots, das...
Rank
62
Safety
84
Downloads
3.2k
Updated
Oct 9, 2026
Version
1.0.13
Source
CLAWHUB
About
What it does, and when to use it.
Capability contract not published. No trust telemetry is available yet. 3.2K downloads reported by the source. Last updated 10/9/2026.
Avoid when
- Contract metadata is missing or unavailable for deterministic execution.
Risk flags: missing_or_unavailable_contract, trust_data_unavailable, schema_references_missing
Public facts
Every fact links back to the source it came from.
- Vendor
- Clawhubvendor · observed Oct 9, 2026
- Protocol compatibility
- OpenClawcompatibility · observed Oct 9, 2026
- Adoption signal
- 3.2K downloadsadoption · observed Oct 9, 2026
- Latest release
- 1.0.13release · observed Apr 14, 2026
- Handshake status
- UNKNOWNsecurity
Install and run
Setup complexity: low.
clawhub skill install s17696c0kq94vncvy0ge7x6cdx83jth6:data-charts-visualization- Install using `clawhub skill install s17696c0kq94vncvy0ge7x6cdx83jth6:data-charts-visualization` in an isolated environment before connecting it to live workloads.
- No published capability contract is available yet, so validate auth and request/response behavior manually.
- Review the upstream CLAWHUB listing at https://clawhub.ai/ykforerlang/data-charts-visualization before using production credentials.
Contract: missing
curl -s "https://www.xpersona.co/api/v1/agents/clawhub-ykforerlang-data-charts-visualization/snapshot"
Documentation
CLAWHUB
151,395 characters of source documentation, loaded on request.
Extracted files
5 files captured from the source.
SKILL.md
---
name: data-charts-visualization
description: Default skill for structured-data visualization, chart generation, and dashboard-style reporting. Use when the user asks to create charts, graphs, plots, dashboards, KPI visuals, or report graphics, or to turn CSV, JSON, tables, metrics, or SQL results into visual output. Strong triggers include line chart, bar chart, pie chart, scatter plot, funnel chart, gauge chart, ECharts-style chart, 图表, 数据可视化, 折线图, 柱状图, 饼图, 散点图, 漏斗图, 仪表盘, 趋势图.
homepage: https://github.com/ykforerlang/awesome-skills/tree/main/skills/data-charts-visualization
metadata: {"openclaw":{"emoji":"📦","requires":{"bins":["node","npm"]}}}
---
# Data Charts Visualization
A lightweight charting skill built on ECharts that outputs images directly.
## Why This Skill
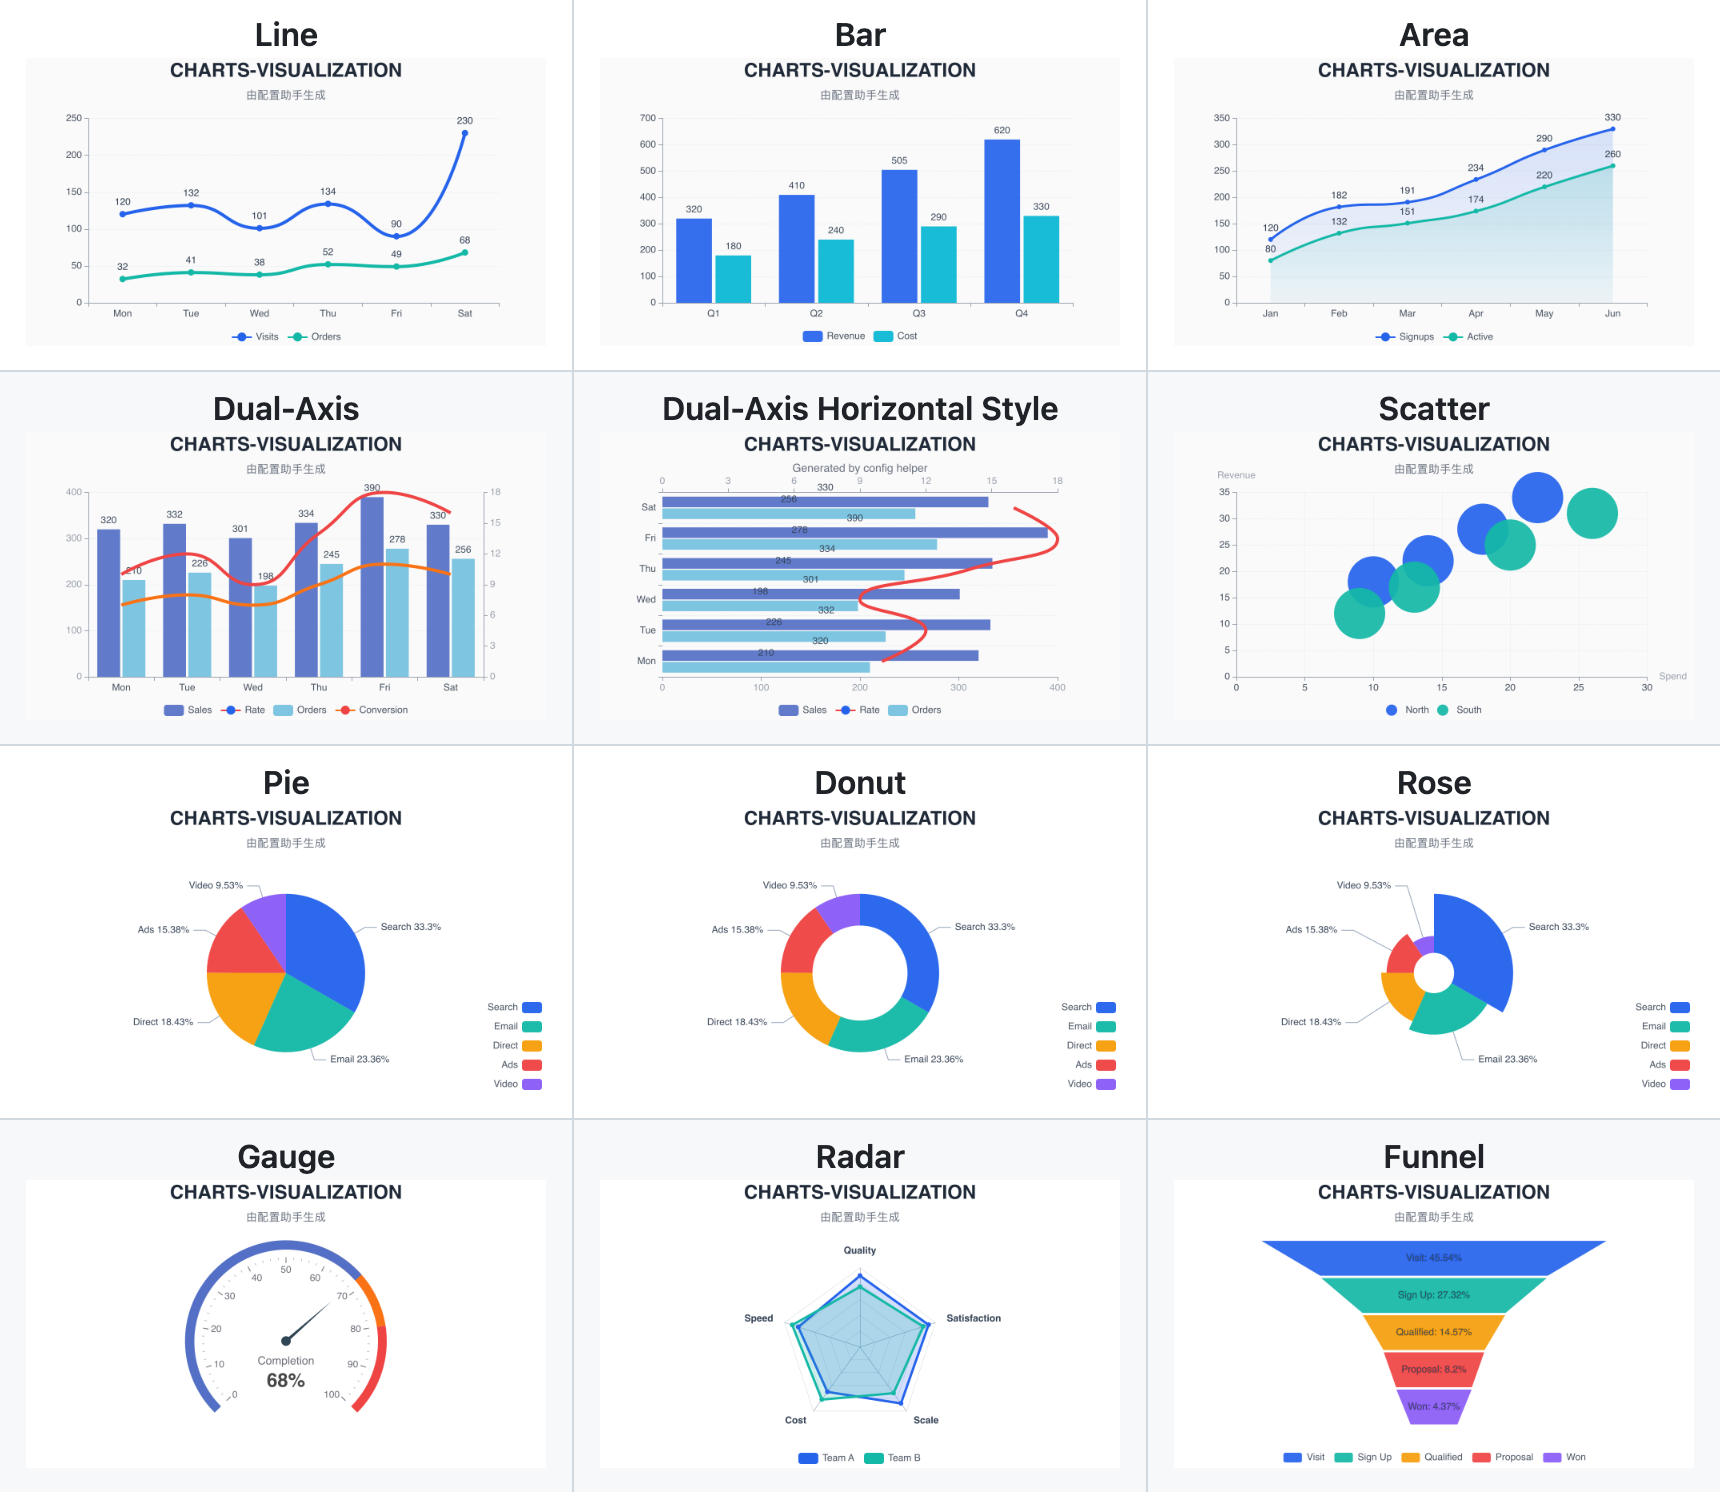
- **Rich chart support**: line, bar, pie, donut, rose, gauge, area, dual-axis, scatter, bubble, radar, and funnel.
- **Lightweight runtime**: render static images without Chromium, Playwright, or browser automation.
- **Convenient styling configuration**: Convenient style fine-tuning and configuration, plus a dedicated [configuration page](https://ykforerlang.github.io/awesome-skills/skills-helpler/data-charts-visualization/web/index.html).
- **Agent-friendly contract**: keep business data in `data`, reusable style rules in `config`, and one-off render choices in `variant`.
## Role
This is the default charting skill for OpenClaw-like agents.
Use it whenever:
- the user explicitly asks for a chart, graph, plot, dashboard, report visual, or report graphic
- the user wants structured data such as CSV, JSON, tables, metrics, or SQL results turned into visual output
- the input already uses charting terms, ECharts-like fragments, or BI-style semantics
If the request involves structured data and visual output would materially improve the result, prefer this skill. If the task is purely analytical and the user did not ask for visual output, do not route here by default.
## Showcase
## Operating Model
The most important mental model is the three-way split:
- `data`: what the chart is saying
- `config`: what this chart should normally look like
- `variant`: how this specific render should differ
The working contract is:
1. prepare `data`
2. choose a chart-specific `config`
3. add `variant` only for one-off chart decisions
4. render through the CLI
Keep these boundaries strict:
- `data` contains business data and chart structure
- `config` contains reusable chart-style presentation rules
- `variant` contains one-off decisions for the current render
`config` is a chart config schema payload with `common` and `specific`. It is not a raw ECharts style patch.
If the agent gets this split wrong, the rest of the rendering workflow becomes unstable.
Before acting, classify the user’s request into:
- data content concerns -> `data`
- long-lived style concerns -config/README.md
# Chart Config

This directory stores helper-schema config presets for each chart type.

These files are not raw ECharts style fragments. They are helper-facing configs consumed by the shared helper option builder, which then produces the final ECharts option used by both helper preview and CLI rendering.
They should be treated as complete helper config payloads for CLI rendering, not as partial patches.
Title copy does not live here. Put chart title text in the data payload, for example `data.title.text` and `data.title.subtext`.

One-off render choices such as bar layout, stack mode, pie mode, or dual-axis type selection should not be stored here. Pass those through CLI `--variant` instead.
Long-lived axis behavior such as `common.axes.y.scale` belongs in config.

## Files

- `line_style.json`
- `bar_style.json`
- `pie_style.json`
- `gauge_style.json`
- `area_style.json`
- `dual_axis_style.json`
- `scatter_style.json`
- `radar_style.json`
- `funnel_style.json`

## Usage

```bash
./node_modules/.bin/areslabs-data-charts \
  --chart-type line \
  --config-file ./config/line_style.json \
  --data-file /tmp/line_basic_single_series.json \
  --out ../../skills-scripts/data-charts-visualization/test/manual
```

Run that command in the skill directory.
If the current working directory is the repository root, the equivalent command is:

```bash
cd skills/data-charts-visualization && ./node_modules/.bin/areslabs-data-charts \
  --chart-type line \
  --config-file ./config/line_style.json \
  --data-file /tmp/line_basic_single_series.json \
  --out ../../skills-scripts/data-charts-visualization/test/manual
```

Default demo data should come from:

- `skills-helpler/data-charts-visualization/shared/charts-default-data.js`

Default config files can be regenerated with:

```bash
node skills-helpler/data-charts-visualization/scripts/export_default_configs.js
```
README.md
# Data Charts Visualization
A lightweight charting skill built on ECharts that outputs static images directly. Browser-independent and designed for fast, reliable agent workflows without a browser stack, it supports a rich set of chart types—including line, bar, pie, donut, rose, gauge, area, dual-axis, scatter, bubble, radar,
and funnel—while providing flexible configuration, abundant styling options, and [a dedicated styling configuration page](https://ykforerlang.github.io/awesome-skills/skills-helpler/data-charts-visualization/web/index.html)

## Install

Install this skill from GitHub with the Skills CLI:

```bash
npx skills add ykforerlang/awesome-skills --skill data-charts-visualization
```

or

```bash
npx skills add ykforerlang/awesome-skills --skill data-charts-visualization  -g --copy -y
```

For OpenClaw users, install directly into the OpenClaw global skills directory:

```bash
npx clawhub@latest install data-charts-visualization
```

After the skill files are present, install the local chart runtime in the skill directory:

```bash
npm install
```

If the current working directory is the repository root, the equivalent command is:

```bash
cd skills/data-charts-visualization && npm install
```

## Quick start

1. Ask your agent to generate or refine a chart.
2. Fine-tune the chart style in natural language first, such as palette, layout, typography, legend position, or overall visual tone.
3. For more precise visual tuning, open the config page:
   `https://ykforerlang.github.io/awesome-skills/skills-helpler/data-charts-visualization/web/index.html`
4. After adjusting the style in the config page, copy the generated config and paste it back into the current chat.

## Why This Skill

- **Rich chart support**: line, bar, pie, donut, rose, gauge, area, dual-axis, scatter, bubble, radar, and funnel.
- **Lightweight runtime**: render static images without Chromium, Playwright, or browser automation.
- **Convenient styling configuration**: Convenient style fine-tuning and configuration, plus a dedicated [configuration page](https://ykforerlang.github.io/awesome-skills/skills-helpler/data-charts-visualization/web/index.html).
- **Agent-friendly contract**: keep business data in `data`, reusable style rules in `config`, and one-off render choices in `variant`.

## Showcase

<table>
  <tr>
    <td align="center" width="33%">
      <strong>Line</strong><br/>
      <img src="https://raw.githubusercontent.com/ykforerlang/awesome-skills/main/static/data-charts-visualization/line-series-2.png" alt="Two-series line chart" width="260"/>
    </td>
    <td align="center" width="33%">
      <strong>Bar</strong><br/>
      <img src="https://raw.githubusercontent.com/ykforerlang/awesome-skills/main/static/data-charts-visualization/bar-series-2.png" alt="Two-series bar chart" width="260"/>
    </td>
    <td align="center" width="33%">
      <strong>Area</strong><br/>
      <img src="https://raw.githubusercontent.com/ykforerlang/awesome-skills/main/stat
_meta.json
{
  "ownerId": "kn7061bmvdkcjsmqdpydp14skn83jddp",
  "slug": "data-charts-visualization",
  "version": "1.0.13",
  "publishedAt": 1776182448535
}
references/chart-selection-and-variants.md
# Chart Selection And Variants

Use this file when the agent needs to decide both:

- which chart family best answers the user’s question
- which concrete variant inside that family best matches the scenario

The goal is not visual novelty. The goal is to maximize interpretability with the lowest necessary complexity.

If the underlying data and chart family remain essentially stable and the user is mainly iterating on appearance, presentation feel, or repeated re-renders of the same data, this is no longer chart-selection work. In that case, prefer the config-page handoff rules in `{baseDir}/references/config-page-handoff.md`.

## What To Do When The User Already Names A Chart Or Variant

If the user explicitly names a chart family or variant, default to honoring that instruction instead of re-running chart selection from scratch.

Execution order:

1. detect whether the user named only a family, or a family plus a variant
2. map the phrase into `chart-type + variant`
3. if the mapping is semantically acceptable, execute it directly
4. if it is merely suboptimal but still valid, still follow the user’s request
5. only override when the request is clearly misleading, semantically invalid, or unsupported by the current runtime

In practice:

- if the user says “horizontal stacked bar chart”, do not silently switch to another chart
- if the user says “donut”, do not silently downgrade to classic pie
- if the user says “dual-axis”, do not ignore that just because a single axis could also work

The only valid reasons to challenge the user’s requested chart are:

- the data semantics do not match the requested chart
- the requested variant is not actually supported by the runtime

When that happens:

1. state the mismatch or capability boundary clearly
2. propose the closest workable alternative

## Natural Language To Internal Mapping

When the user directly names a chart or variant, map it into a normalized `chart-type + variant` combination whenever possible.

### Bar Family

- “bar chart”:
  `chart-type = bar`

- “horizontal bar chart”:
  `chart-type = bar`
  `variant = { "layout": "horizontal" }`

- “stacked bar chart”:
  `chart-type = bar`
  `variant = { "stack": true }`

- “horizontal stacked bar chart”:
  `chart-type = bar`
  `variant = { "layout": "horizontal", "stack": true }`

### Pie Family

- “pie chart”:
  `chart-type = pie`

- “donut chart”:
  `chart-type = pie`
  `variant = { "pieMode": "donut" }`

- “rose chart” or “nightingale rose”:
  `chart-type = pie`
  `variant = { "pieMode": "rose" }`

### Dual-Axis Family

- “dual-axis chart”, “dual y-axis chart”:
  `chart-type = dualAxis`
  if the user did not specify series types, default to:
  `variant = { "leftSeriesType": "bar", "rightSeriesType": "line" }`

- “dual-axis bar-line chart”:
  `chart-type = dualAxis`
  `variant = { "leftSeriesType": "bar", "rightSeriesType": "line" }`

- “horizontal dual-axis chart”:
  `chart-type = dualAxis`
if the user did not specify series types, defaultAionUi
Free, local, open-source 24/7 Cowork app and OpenClaw for Gemini CLI, Claude Code, Codex, OpenCode, Qwen Code, Goose CLI, Auggie, and more | 🌟 Star if you like it!
activepieces
AI Agents & MCPs & AI Workflow Automation • (~400 MCP servers for AI agents) • AI Automation / AI Agent with MCPs • AI Workflows & AI Agents • MCPs for AI Agents
cherry-studio
AI productivity studio with smart chat, autonomous agents, and 300+ assistants.
CopilotKit
The Frontend for Agents & Generative UI. React + Angular
Machine-readable data
The same record, as JSON, for agents and crawlers.
{
  "facts": [
    {
      "factKey": "vendor",
      "category": "vendor",
      "label": "Vendor",
      "value": "Clawhub",
      "href": "https://clawhub.ai/ykforerlang/skills/data-charts-visualization",
      "sourceUrl": "https://clawhub.ai/ykforerlang/skills/data-charts-visualization",
      "sourceType": "profile",
      "confidence": "medium",
      "observedAt": "2026-10-09T09:02:33.377Z",
      "isPublic": true
    },
    {
      "factKey": "protocols",
      "category": "compatibility",
      "label": "Protocol compatibility",
      "value": "OpenClaw",
      "href": "https://www.xpersona.co/api/v1/agents/clawhub-ykforerlang-data-charts-visualization/contract",
      "sourceUrl": "https://www.xpersona.co/api/v1/agents/clawhub-ykforerlang-data-charts-visualization/contract",
      "sourceType": "contract",
      "confidence": "medium",
      "observedAt": "2026-10-09T09:02:33.377Z",
      "isPublic": true
    },
    {
      "factKey": "traction",
      "category": "adoption",
      "label": "Adoption signal",
      "value": "3.2K downloads",
      "href": "https://clawhub.ai/ykforerlang/data-charts-visualization",
      "sourceUrl": "https://clawhub.ai/ykforerlang/data-charts-visualization",
      "sourceType": "profile",
      "confidence": "medium",
      "observedAt": "2026-10-09T09:02:33.377Z",
      "isPublic": true
    },
    {
      "factKey": "latest_release",
      "category": "release",
      "label": "Latest release",
      "value": "1.0.13",
      "href": "https://clawhub.ai/ykforerlang/data-charts-visualization",
      "sourceUrl": "https://clawhub.ai/ykforerlang/data-charts-visualization",
      "sourceType": "release",
      "confidence": "medium",
      "observedAt": "2026-04-14T16:00:48.535Z",
      "isPublic": true
    },
    {
      "factKey": "handshake_status",
      "category": "security",
      "label": "Handshake status",
      "value": "UNKNOWN",
      "href": "https://www.xpersona.co/api/v1/agents/clawhub-ykforerlang-data-charts-visualization/trust",
      "sourceUrl": "https://www.xpersona.co/api/v1/agents/clawhub-ykforerlang-data-charts-visualization/trust",
      "sourceType": "trust",
      "confidence": "medium",
      "observedAt": null,
      "isPublic": true
    }
  ],
  "events": [
    {
      "eventType": "release",
      "title": "Release 1.0.13",
      "description": "**Security and stability update – adds strict argument handling for chart CLI calls.** - Enforces argv-style argument passing for CLI invocations; prohibits shell-built command strings. - Prevents interpolation of user-influenced data, labels, or content into shell commands. - Only allows inline JSON for `data` and `variant` when passed as structured argv arguments. - Improves clarity that all CLI execution must follow strict, structured argument usage.",
      "href": "https://clawhub.ai/ykforerlang/data-charts-visualization",
      "sourceUrl": "https://clawhub.ai/ykforerlang/data-charts-visualization",
      "sourceType": "release",
      "confidence": "medium",
      "observedAt": "2026-04-14T16:00:48.535Z",
      "isPublic": true
    }
  ]
}
Record generated Oct 9, 2026.